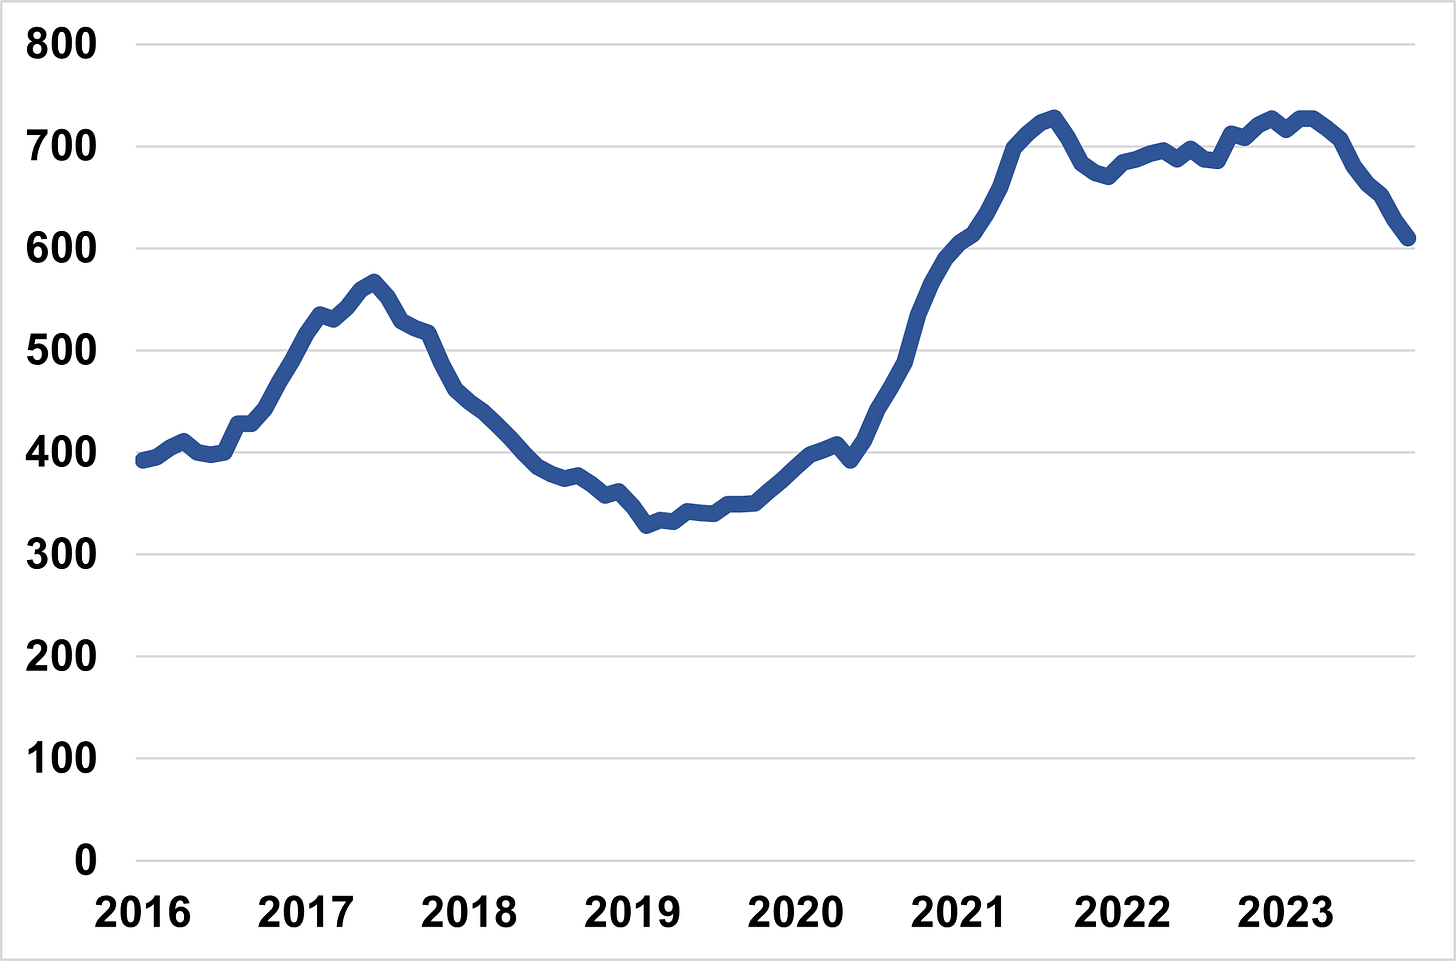
Murder is falling in the United States, as you might have heard. It was down 12 percent as of October 31 in 168 cities with available data while fatal shootings were down just about 7 percent YTD in Gun Violence Archive data.
There is a bit of a lull in the crime data calendar where there aren’t any new releases but we don’t want to start wrapping up the year just yet. For this post, therefore, I thought I would graph as best I could shooting trends rolling over time (much better than YTD) in places with data to show just what plunging gun violence looks like in many American cities.
The incomplete list of cities that have data includes New Orleans:
Philadelphia:
New York City:
Chicago:
New York State GIVE Agencies:
Omaha:

Portland:
Rochester, NY:
Toledo:
And Baltimore:
The trends between these cities are remarkably similar. Most of the cities saw big increases around the same point in mid-2020 and most of the cities began to see sudden, large declines at some point in late 2022 or the first half of 2023.
There are other places that only produce YTD counts that are seeing declining gun violence and murders this year (like Los Angeles where shooting victims are down 10.4 percent this year). There are places like Cincinnati that are seeing declining gun violence but did not see quite so large a rise in 2020. And there are other places that are seeing level (Seattle and Wilmington) or slightly increasing gun violence this year.
There are also a number of cities with increases in murder so far this year but declines in shooting victims. Murder is up Aurora, CO 12.9 percent but shootings victims are down 25.2 percent. Murder is up 13.5 percent in Durham, NC but shooting victims are down 19.9 percent. And murder is up a whopping 72.7 percent in New Haven, CT (19 in 2023 vs 11 in 2022) while shooting victims are down around1 23 percent.
Most cities with available incident or victim-level data on shootings are following the same trend though there are certainly places that are not. We don’t have shooting data for Memphis or Washington, DC but I’m guessing you wouldn’t see declining gun violence there.
That said, the trends we do see should be indicative of national (rather than mainly local) drivers of changing gun violence. The more we can understand what drove gun violence up in 2020 and what is driving it down in 2023 the better we can respond to gun violence both today and in the future.
New Haven does not specify the weapon used in murder victims, but the vast majority of New Haven murder victims each year come via firearm so this estimate comes from adding up non-fatal victims and murder victims for YTD 2022 vs YTD 2023.


Violent crime is both a power law (dominated by a tiny minority) and locality phenomena. High homicide rates are concentrated in under-policed fiscal-sink localities (localities where government expenditure is systematically higher than revenue).
Anti-police activism after George Floyd died — in a context of media concentrating its reporting on police killings that fitted its “structural racism” narrative — led to police retreat from such localities, driving down clearance rates and so increasing homicides. As folk have realised how disastrous that was, policing of such localities is recovering, so clearance rates are going up, hence homicide rates are falling.
https://www.lorenzofromoz.net/p/race-and-other-annoyances
What's in a word? Why are shootings called "gun violence," while stabbings are not called knife violence?