

The FBI released its 2025 Crime in the United States report on a Friday afternoon which wasn’t there fault but also was super great for getting a ton of attention on the fact that murder fell at the fastest pace ever recorded to the lowest rate recorded since the FBI started its modern estimates.
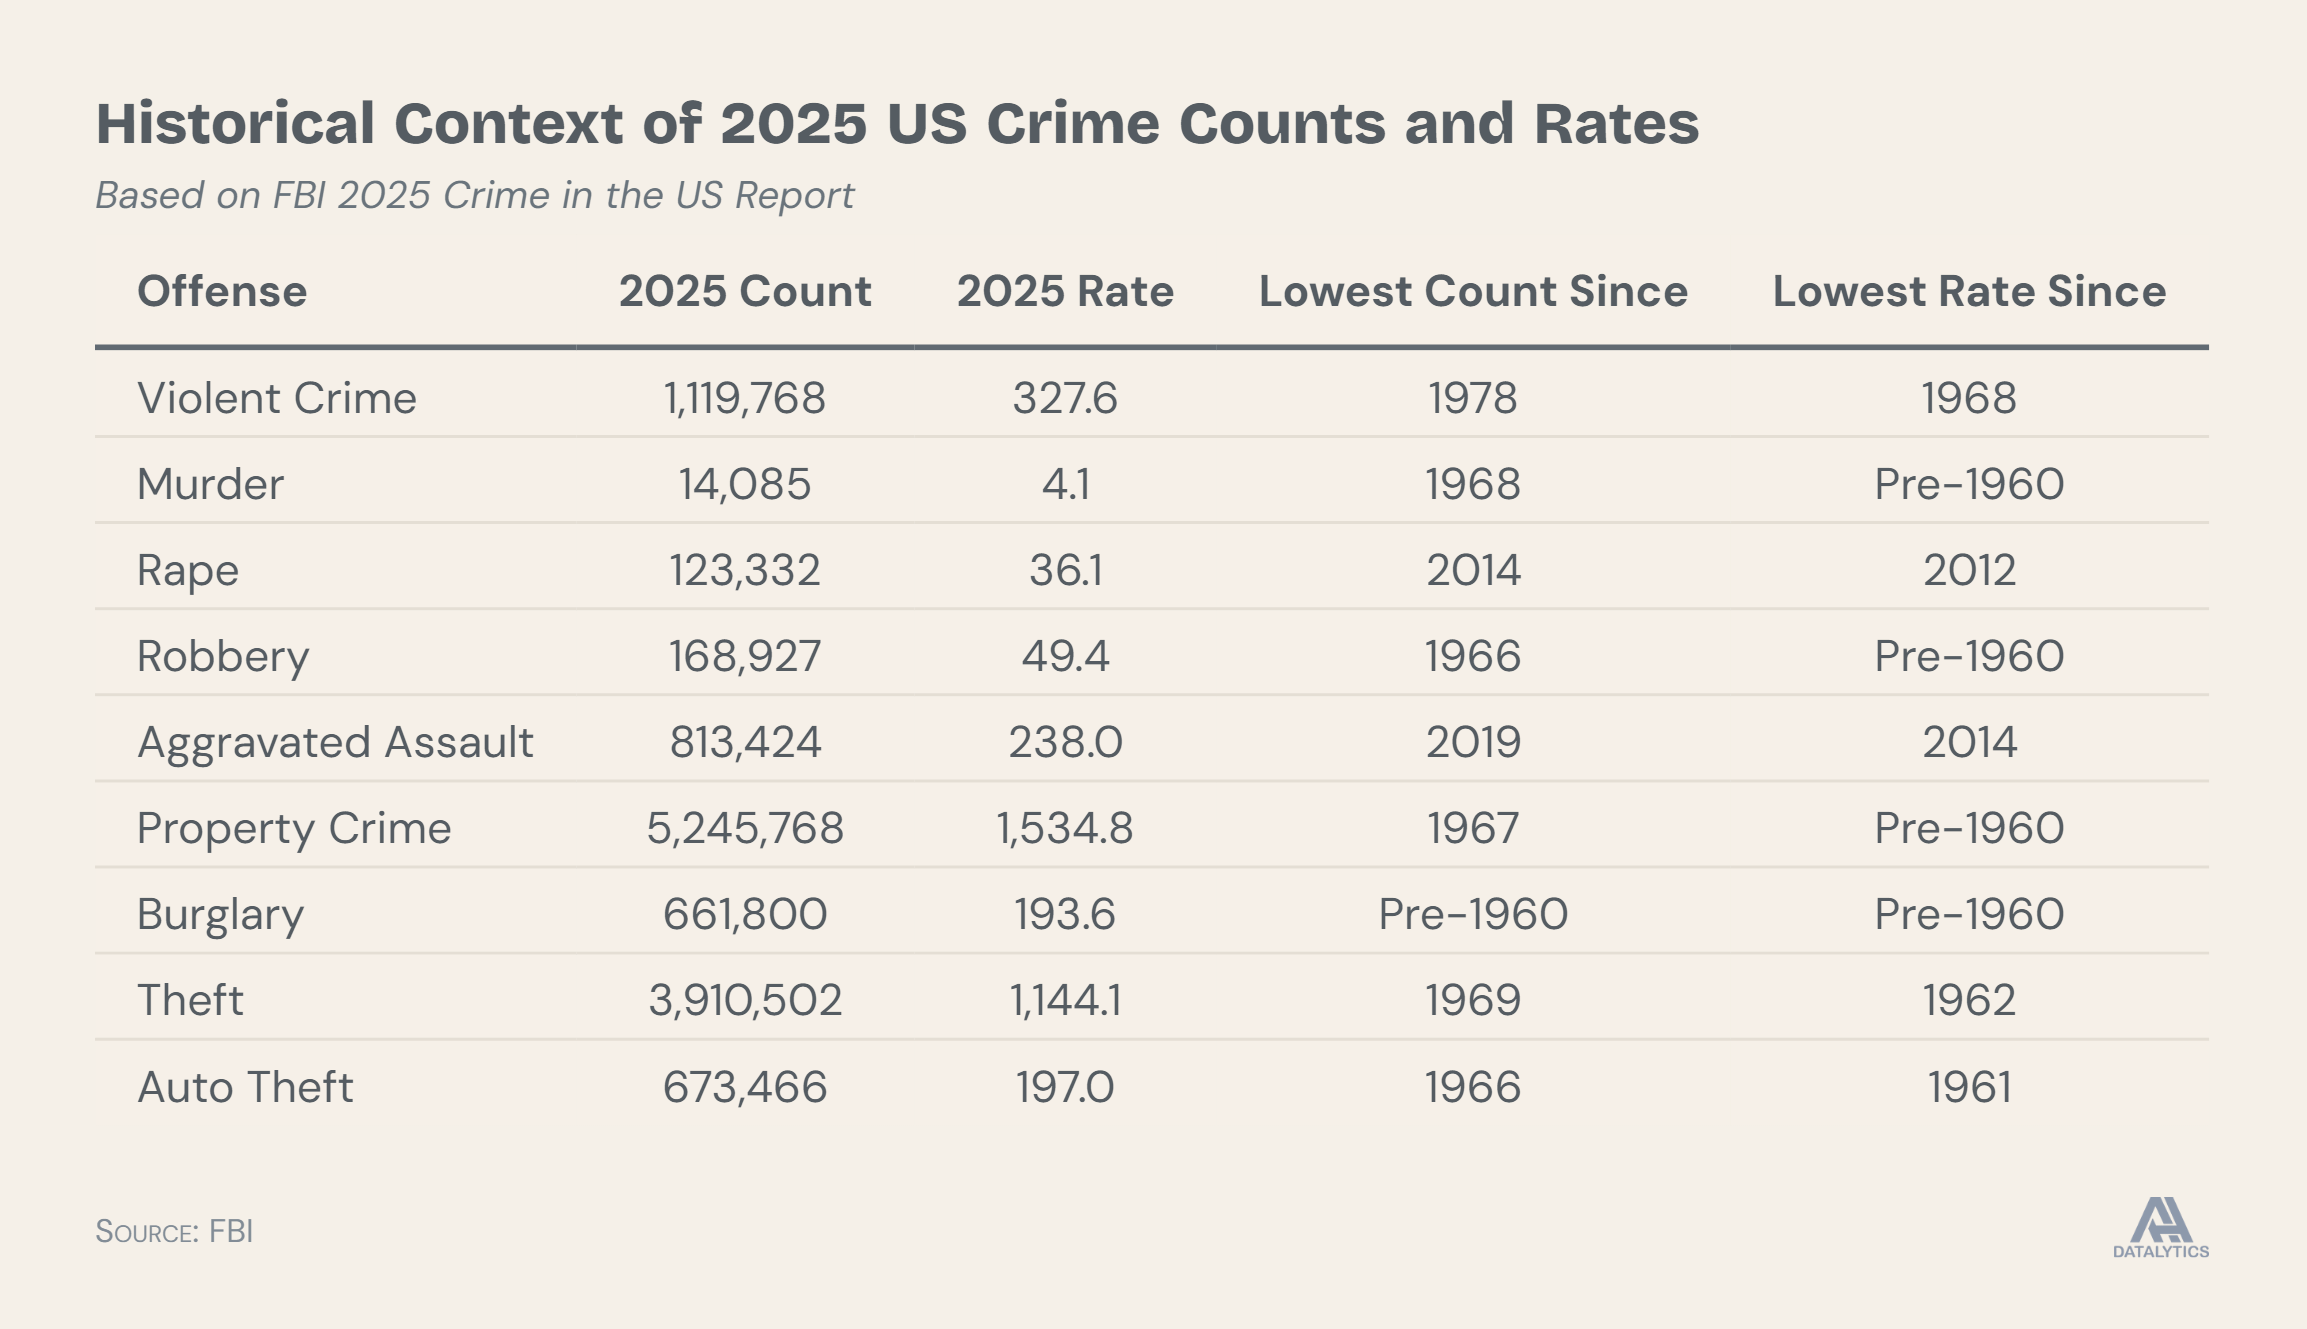
It wasn’t just the US murder rate that has reached a historic low though as clearly seen in the below table of every crime type.
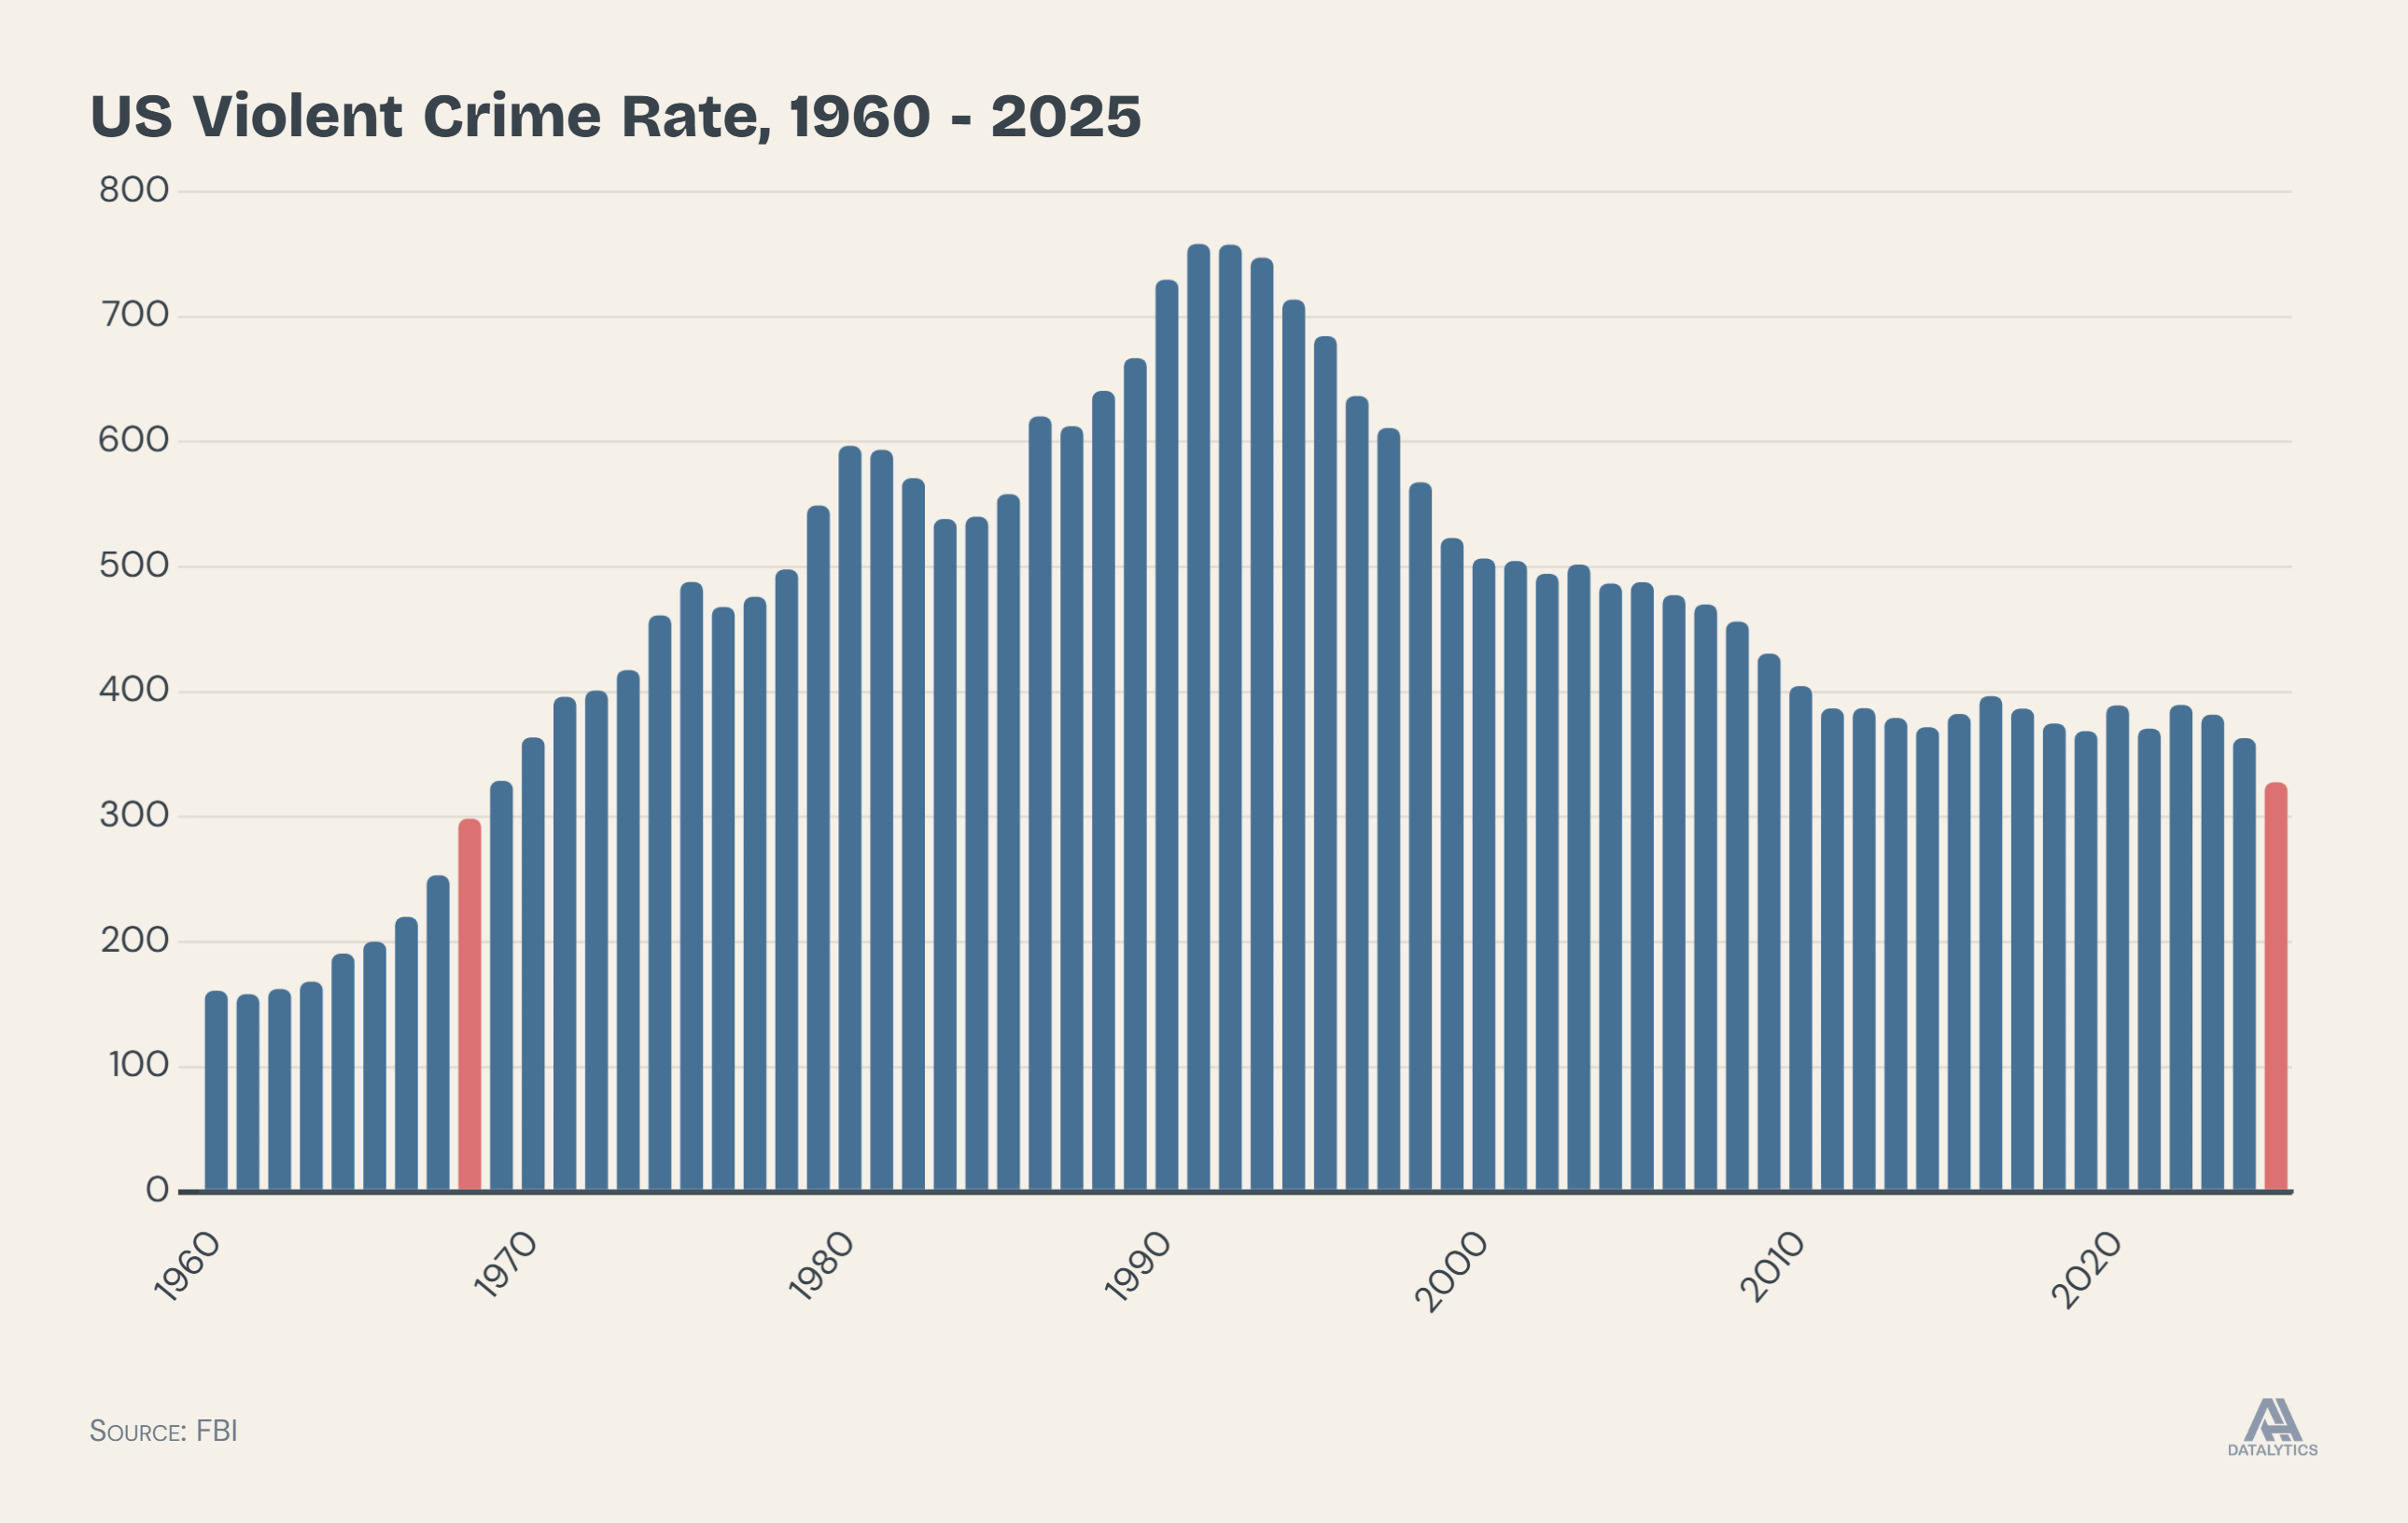
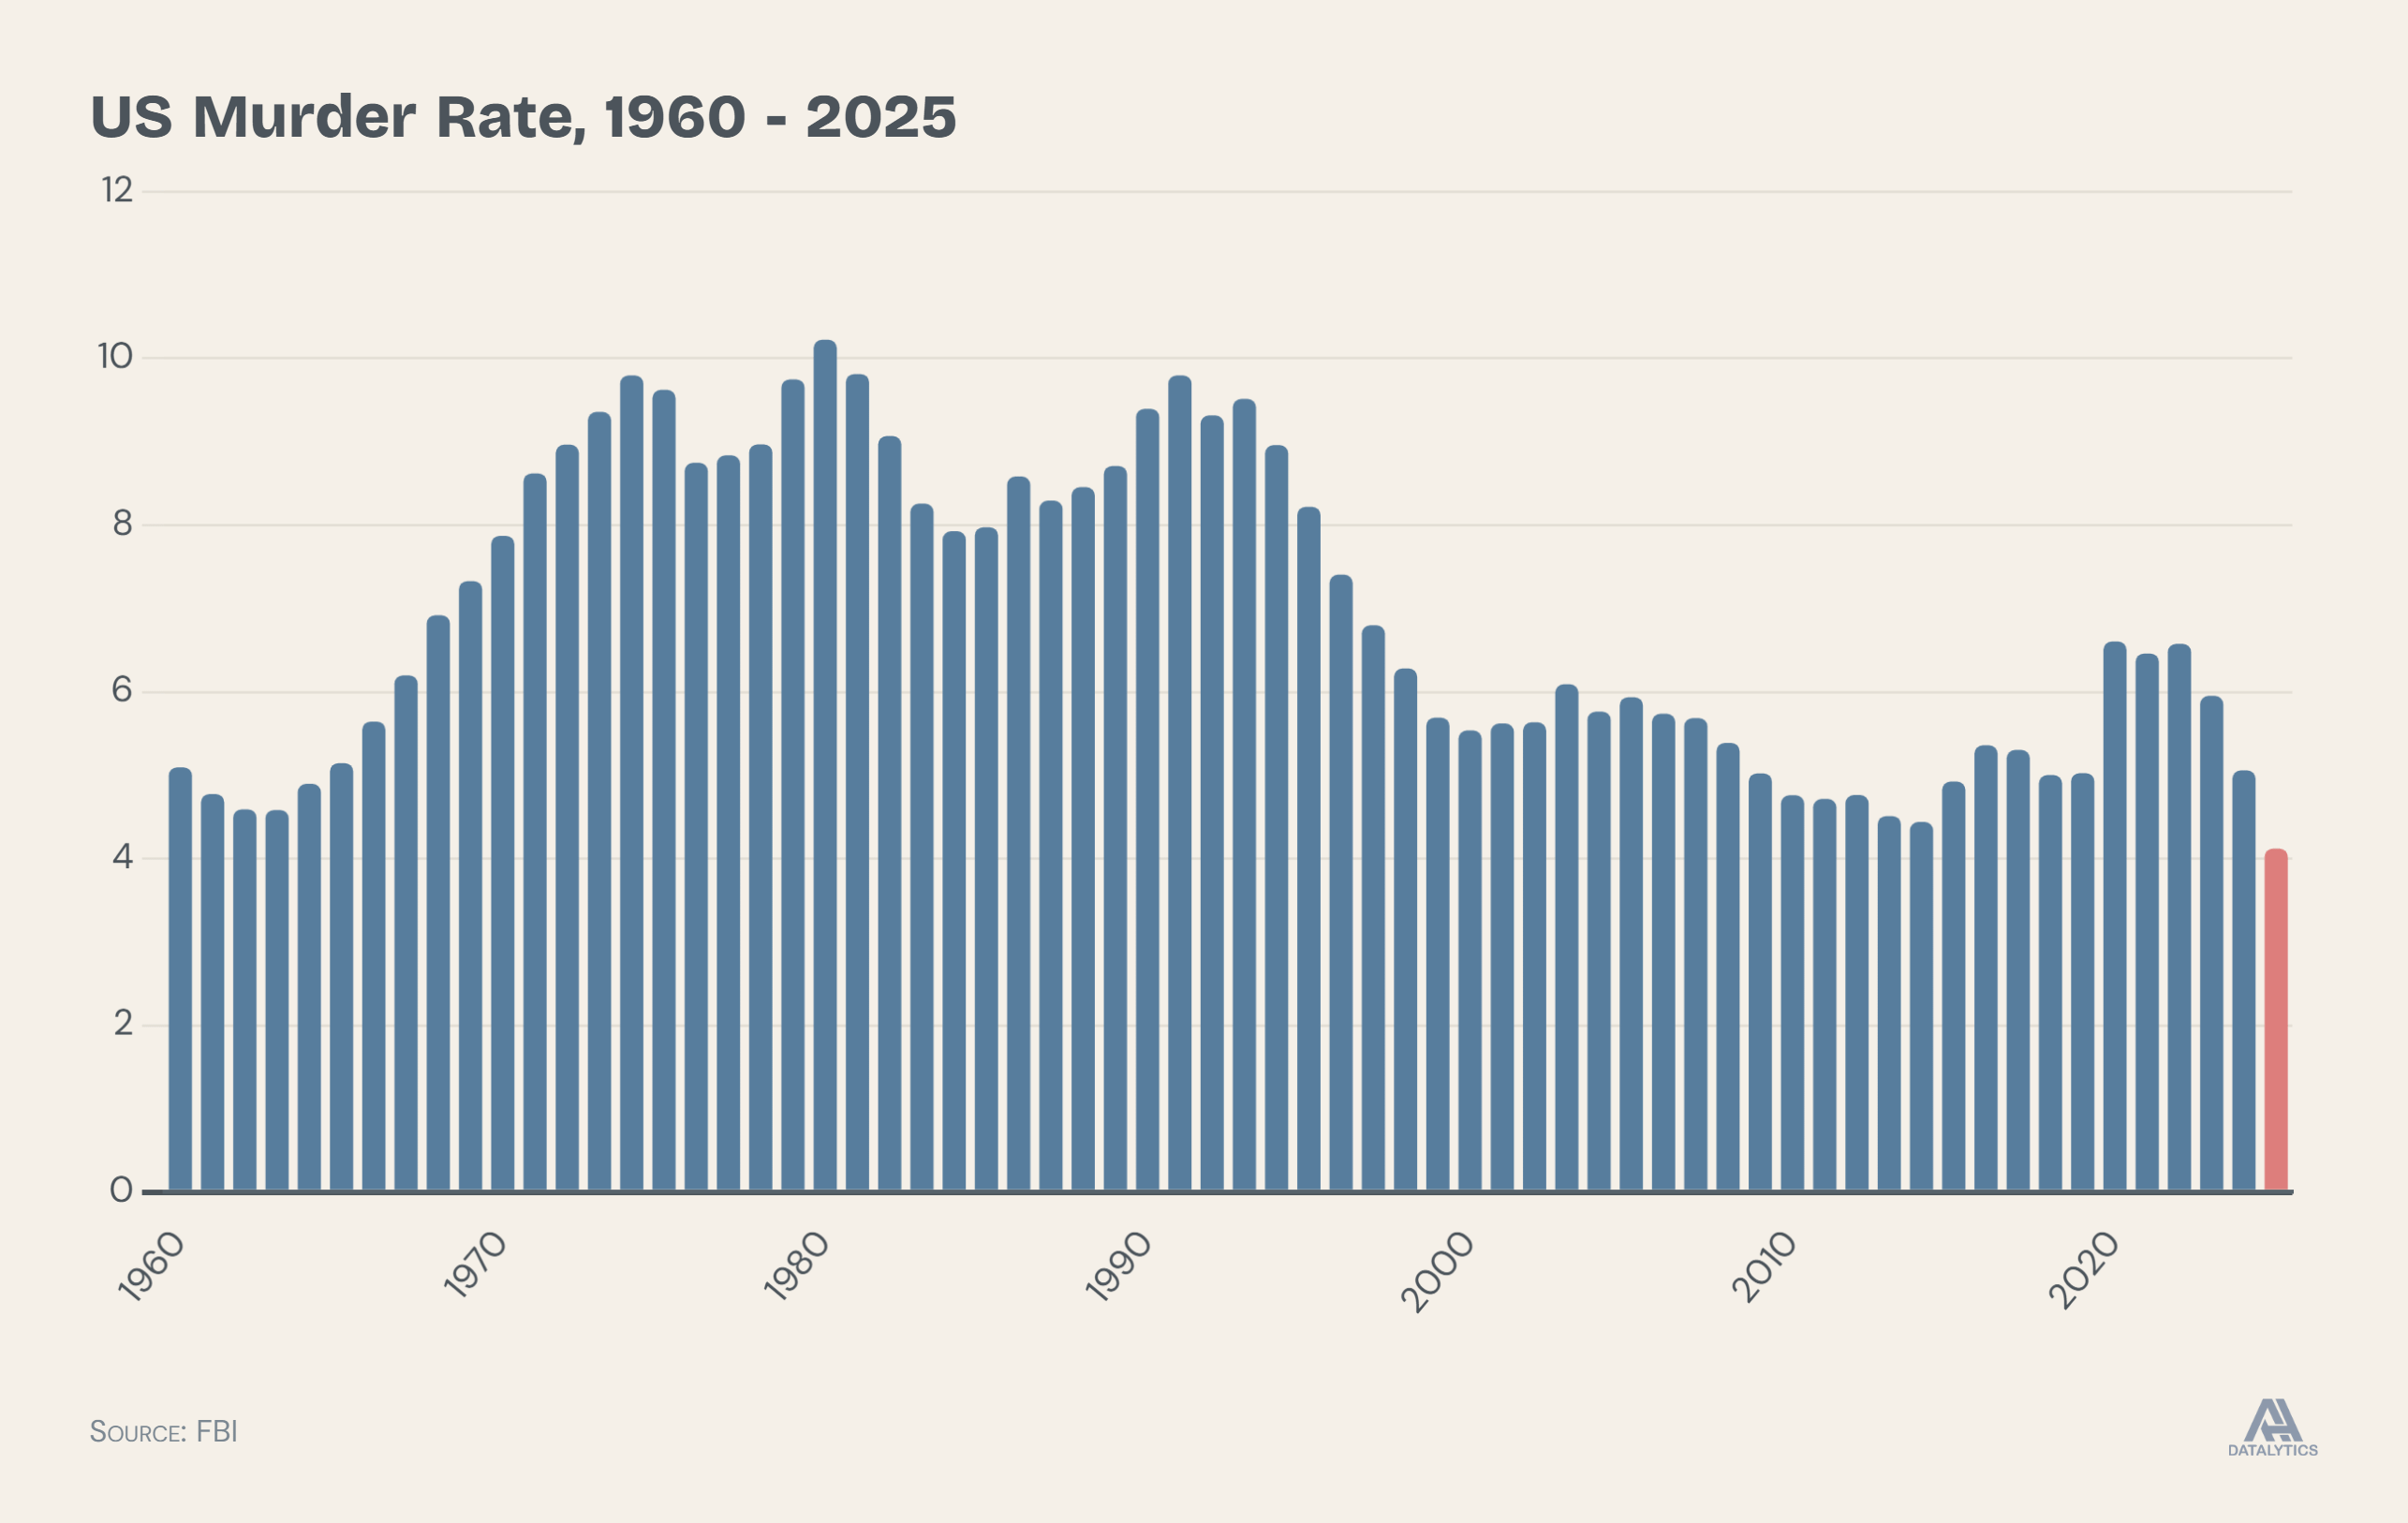
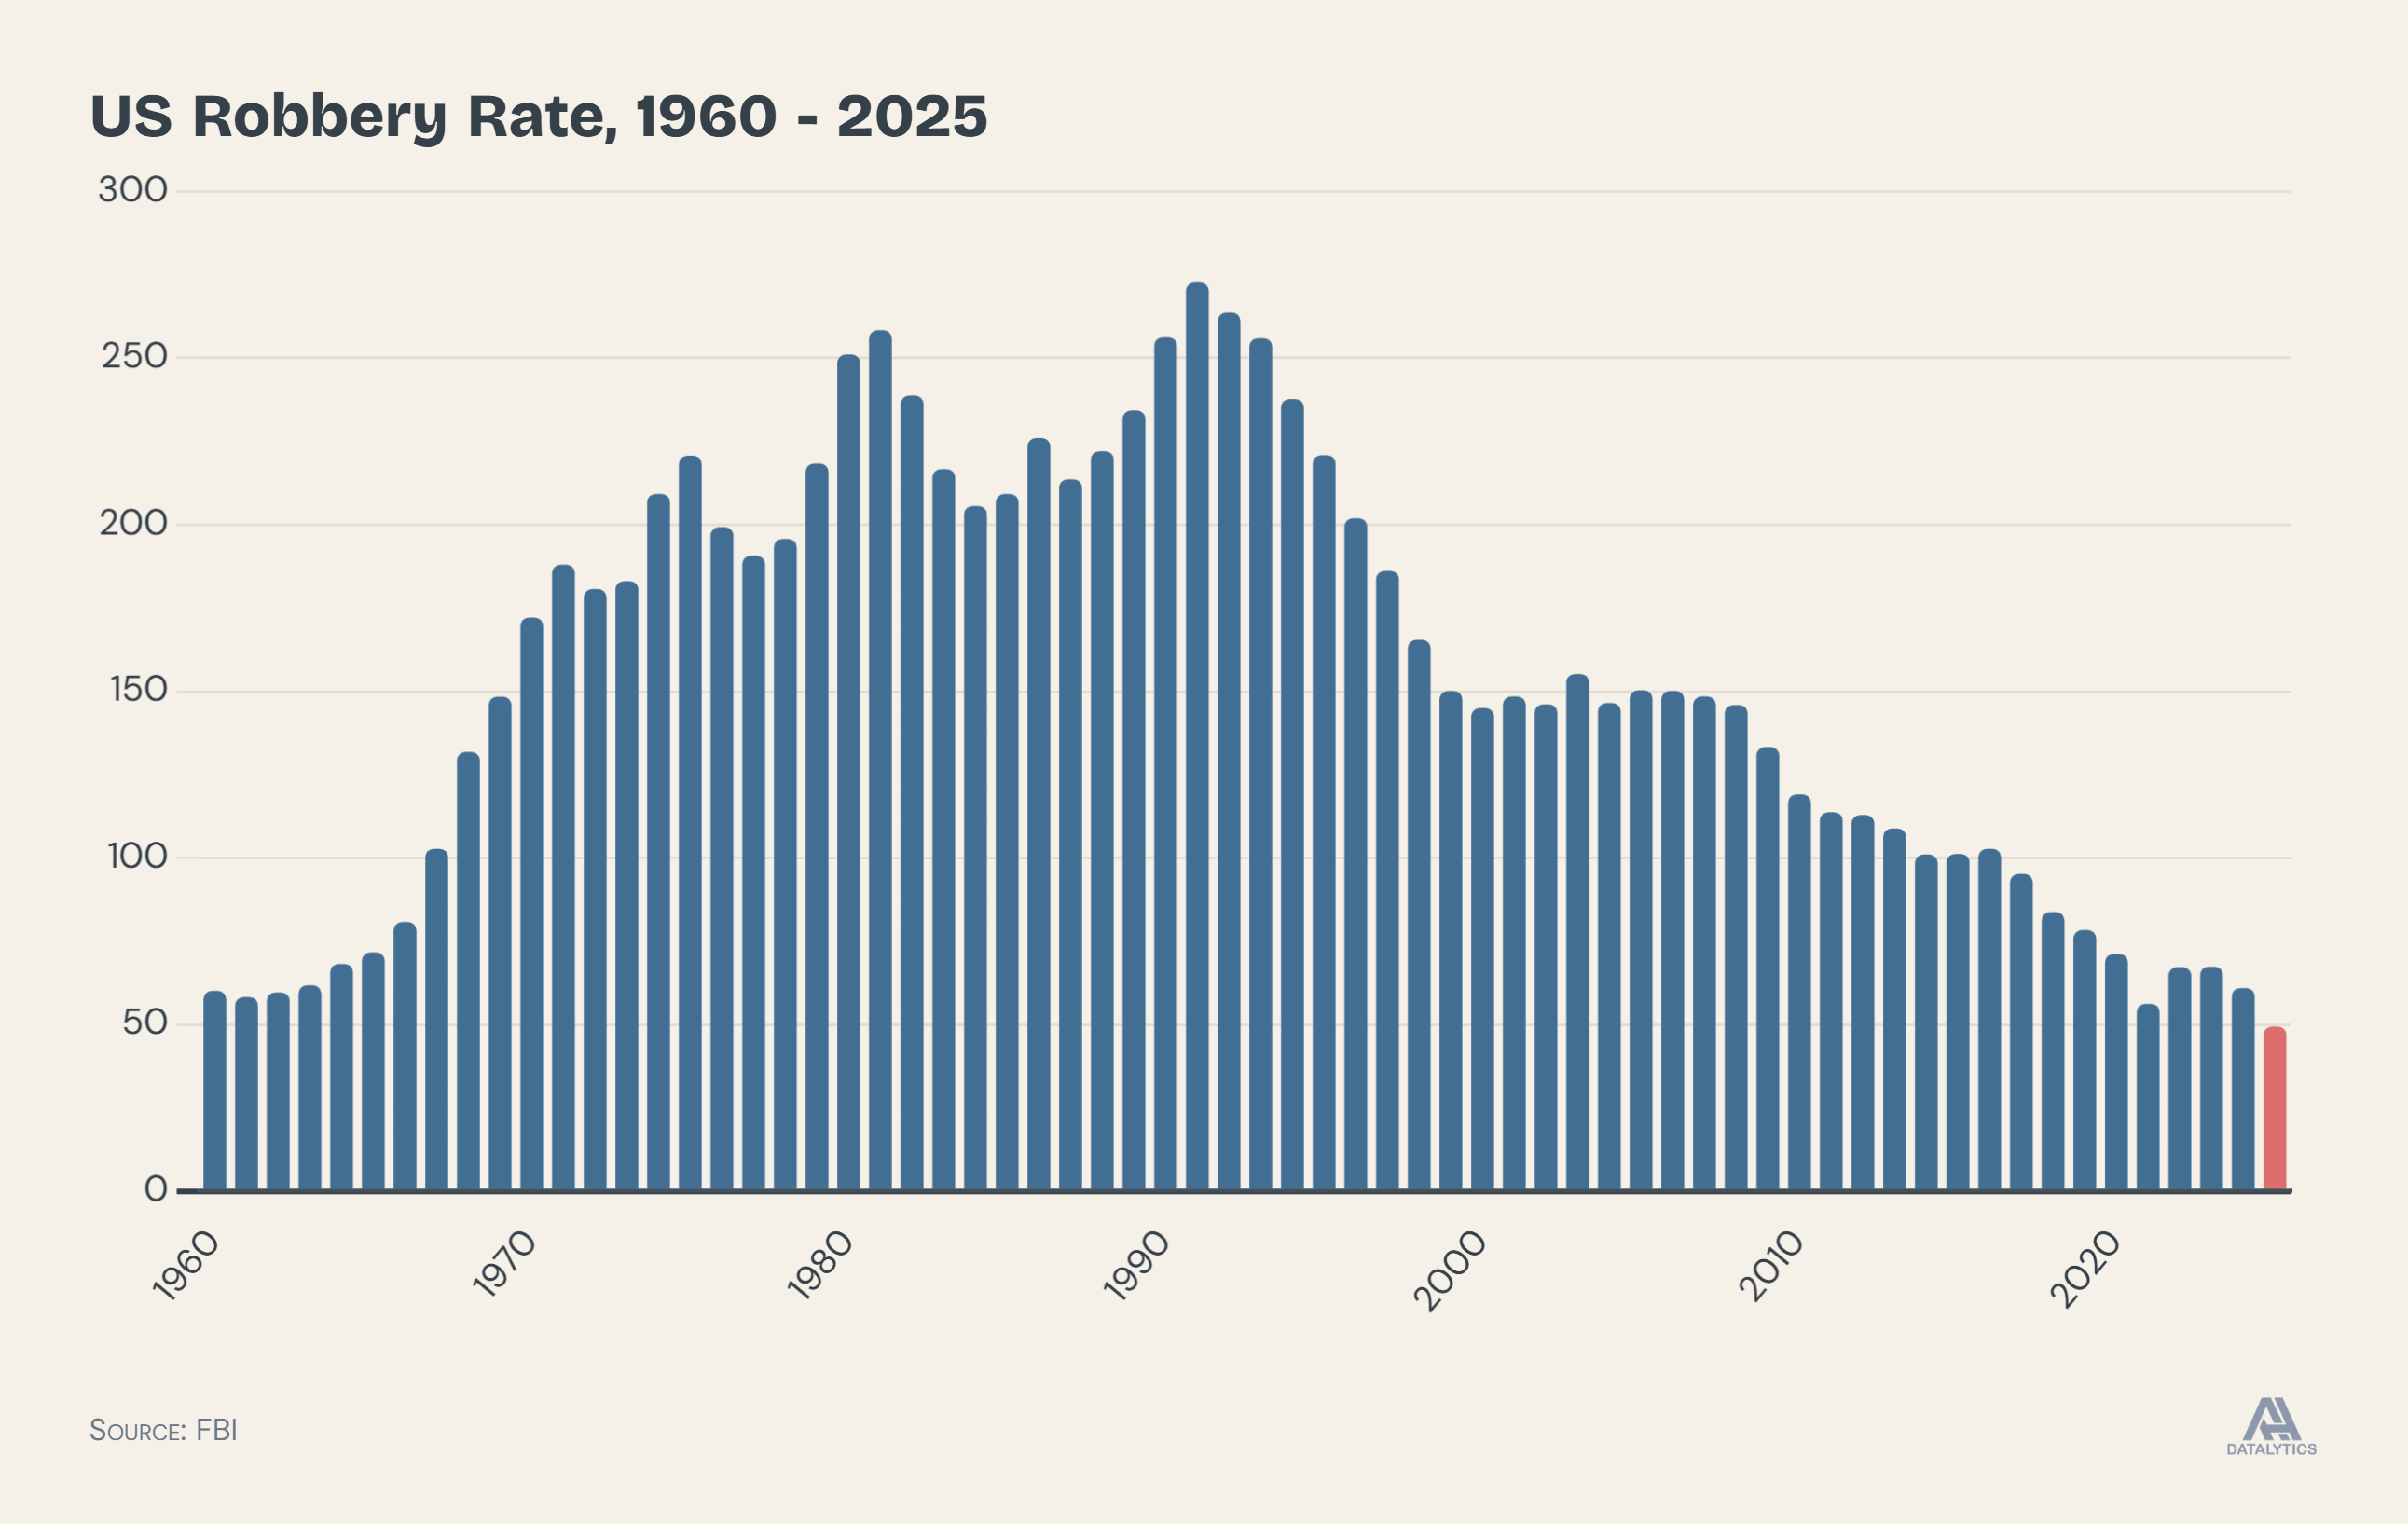
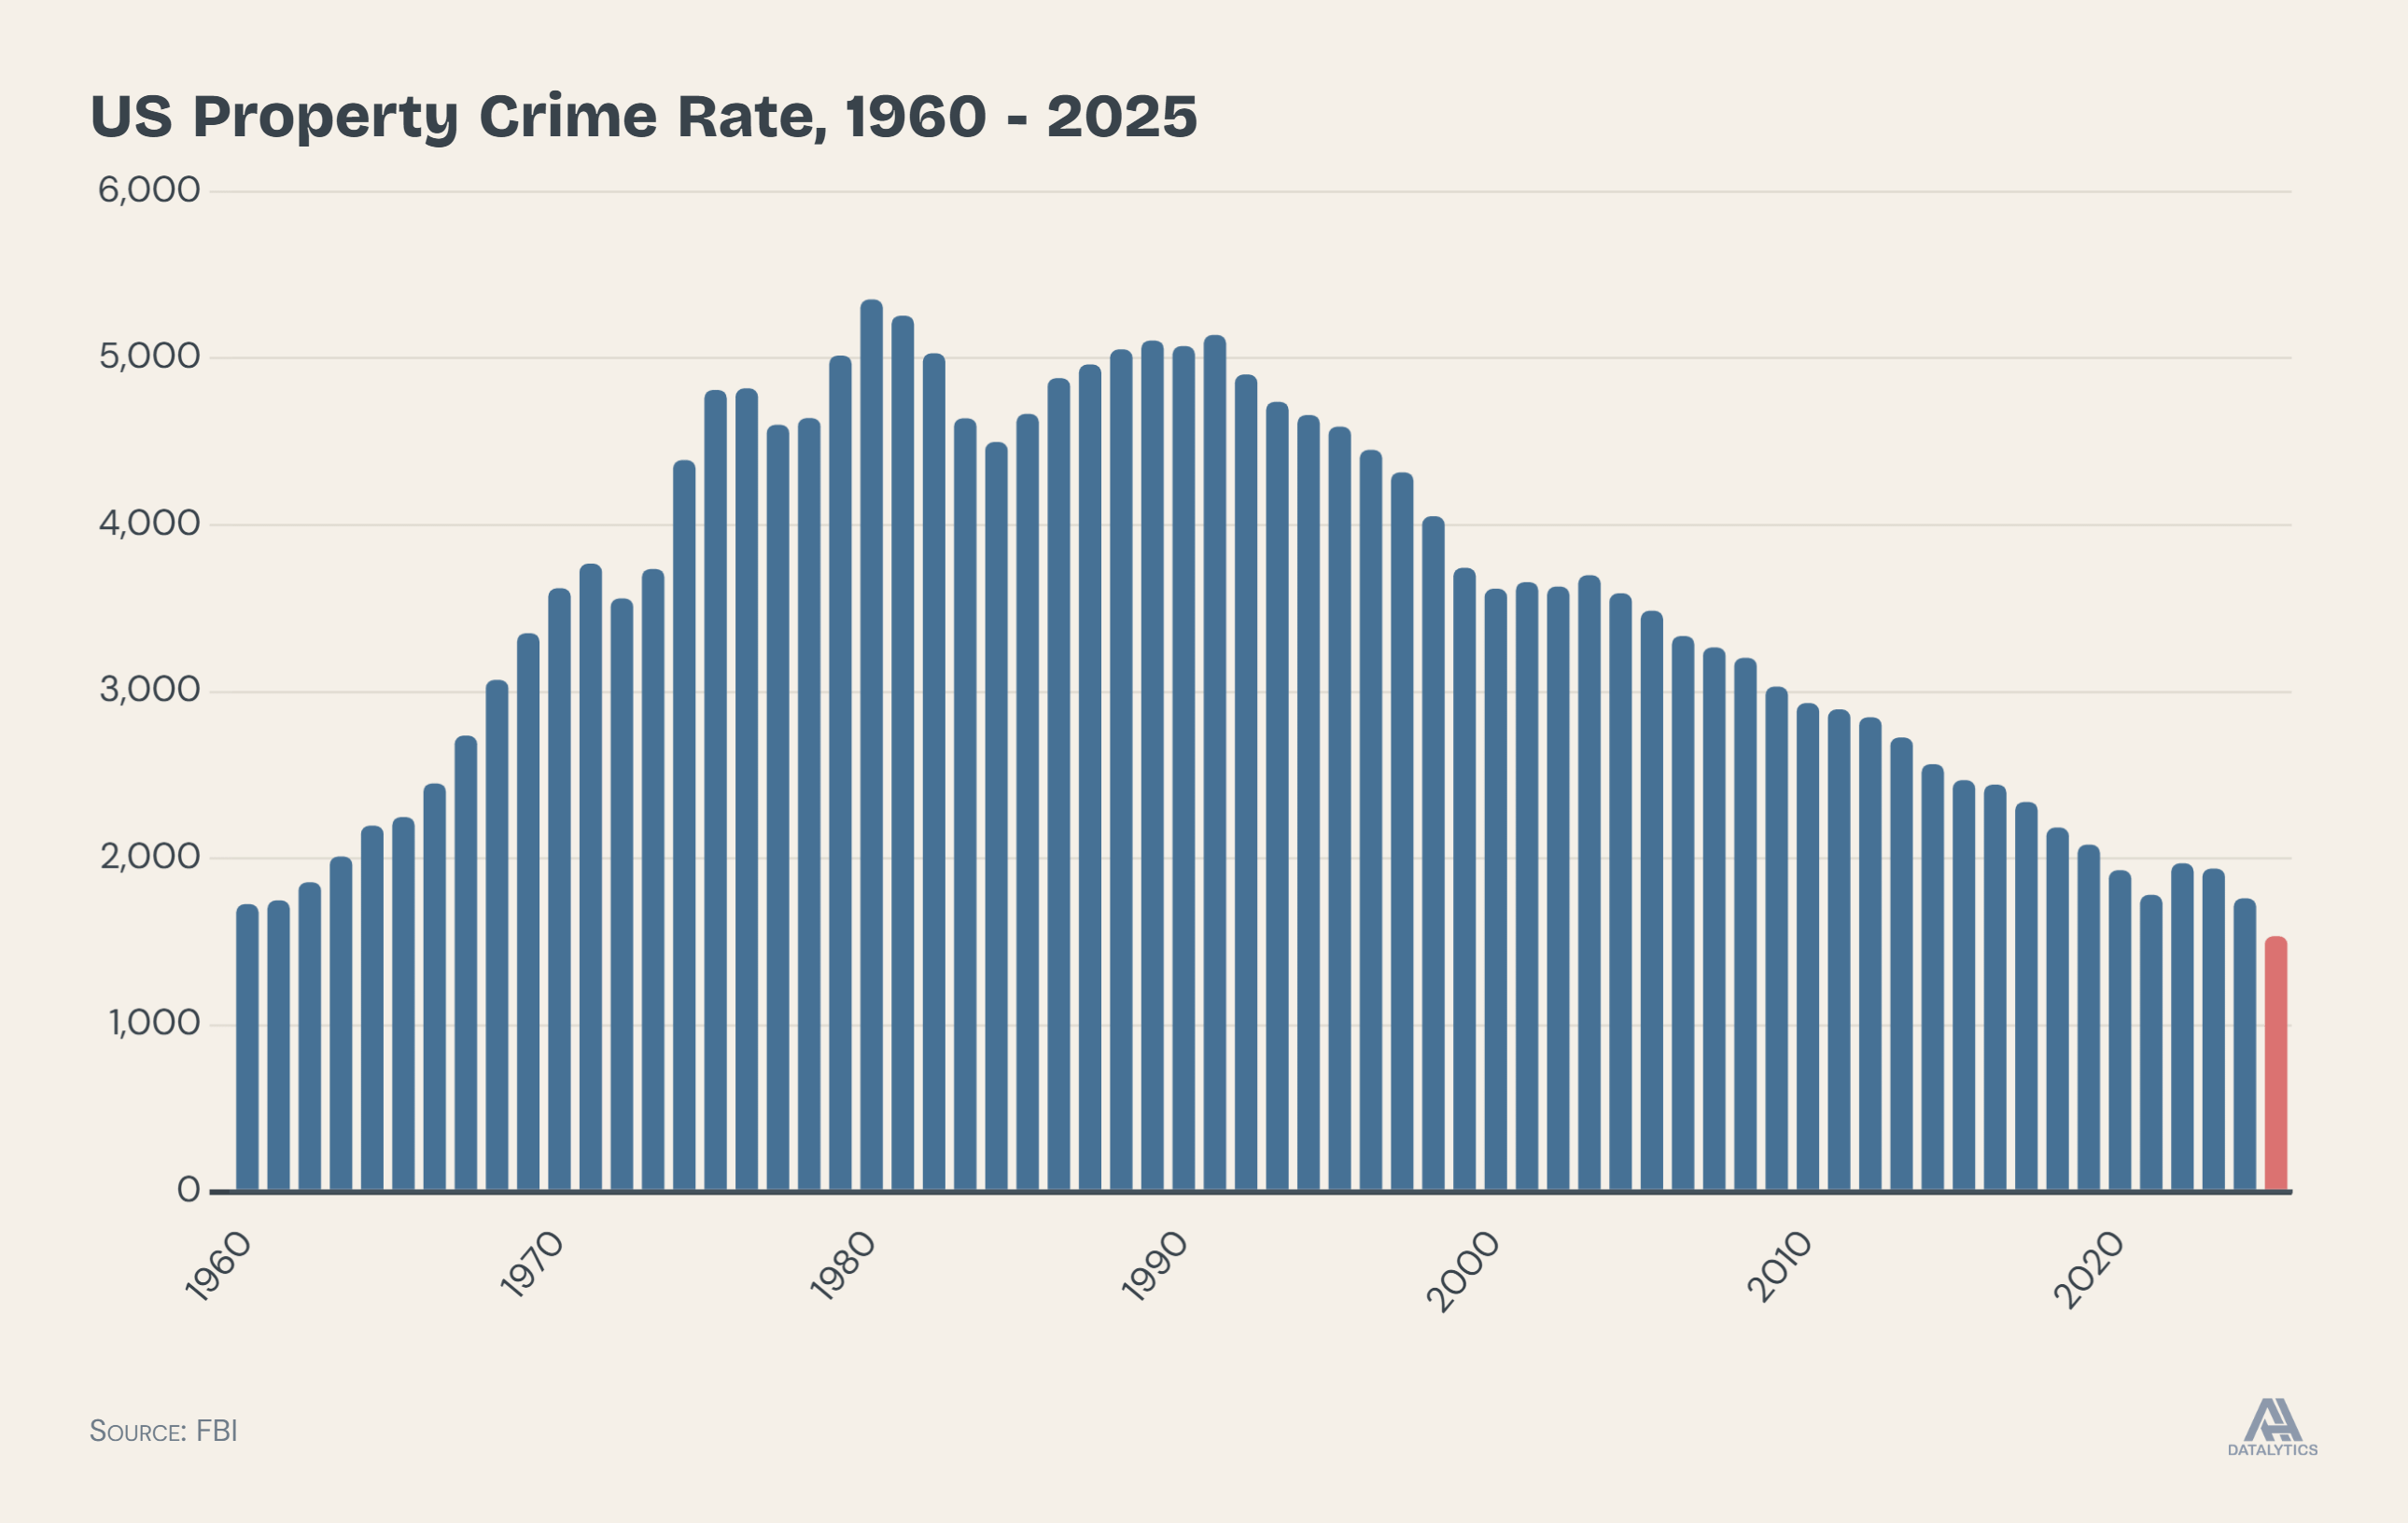
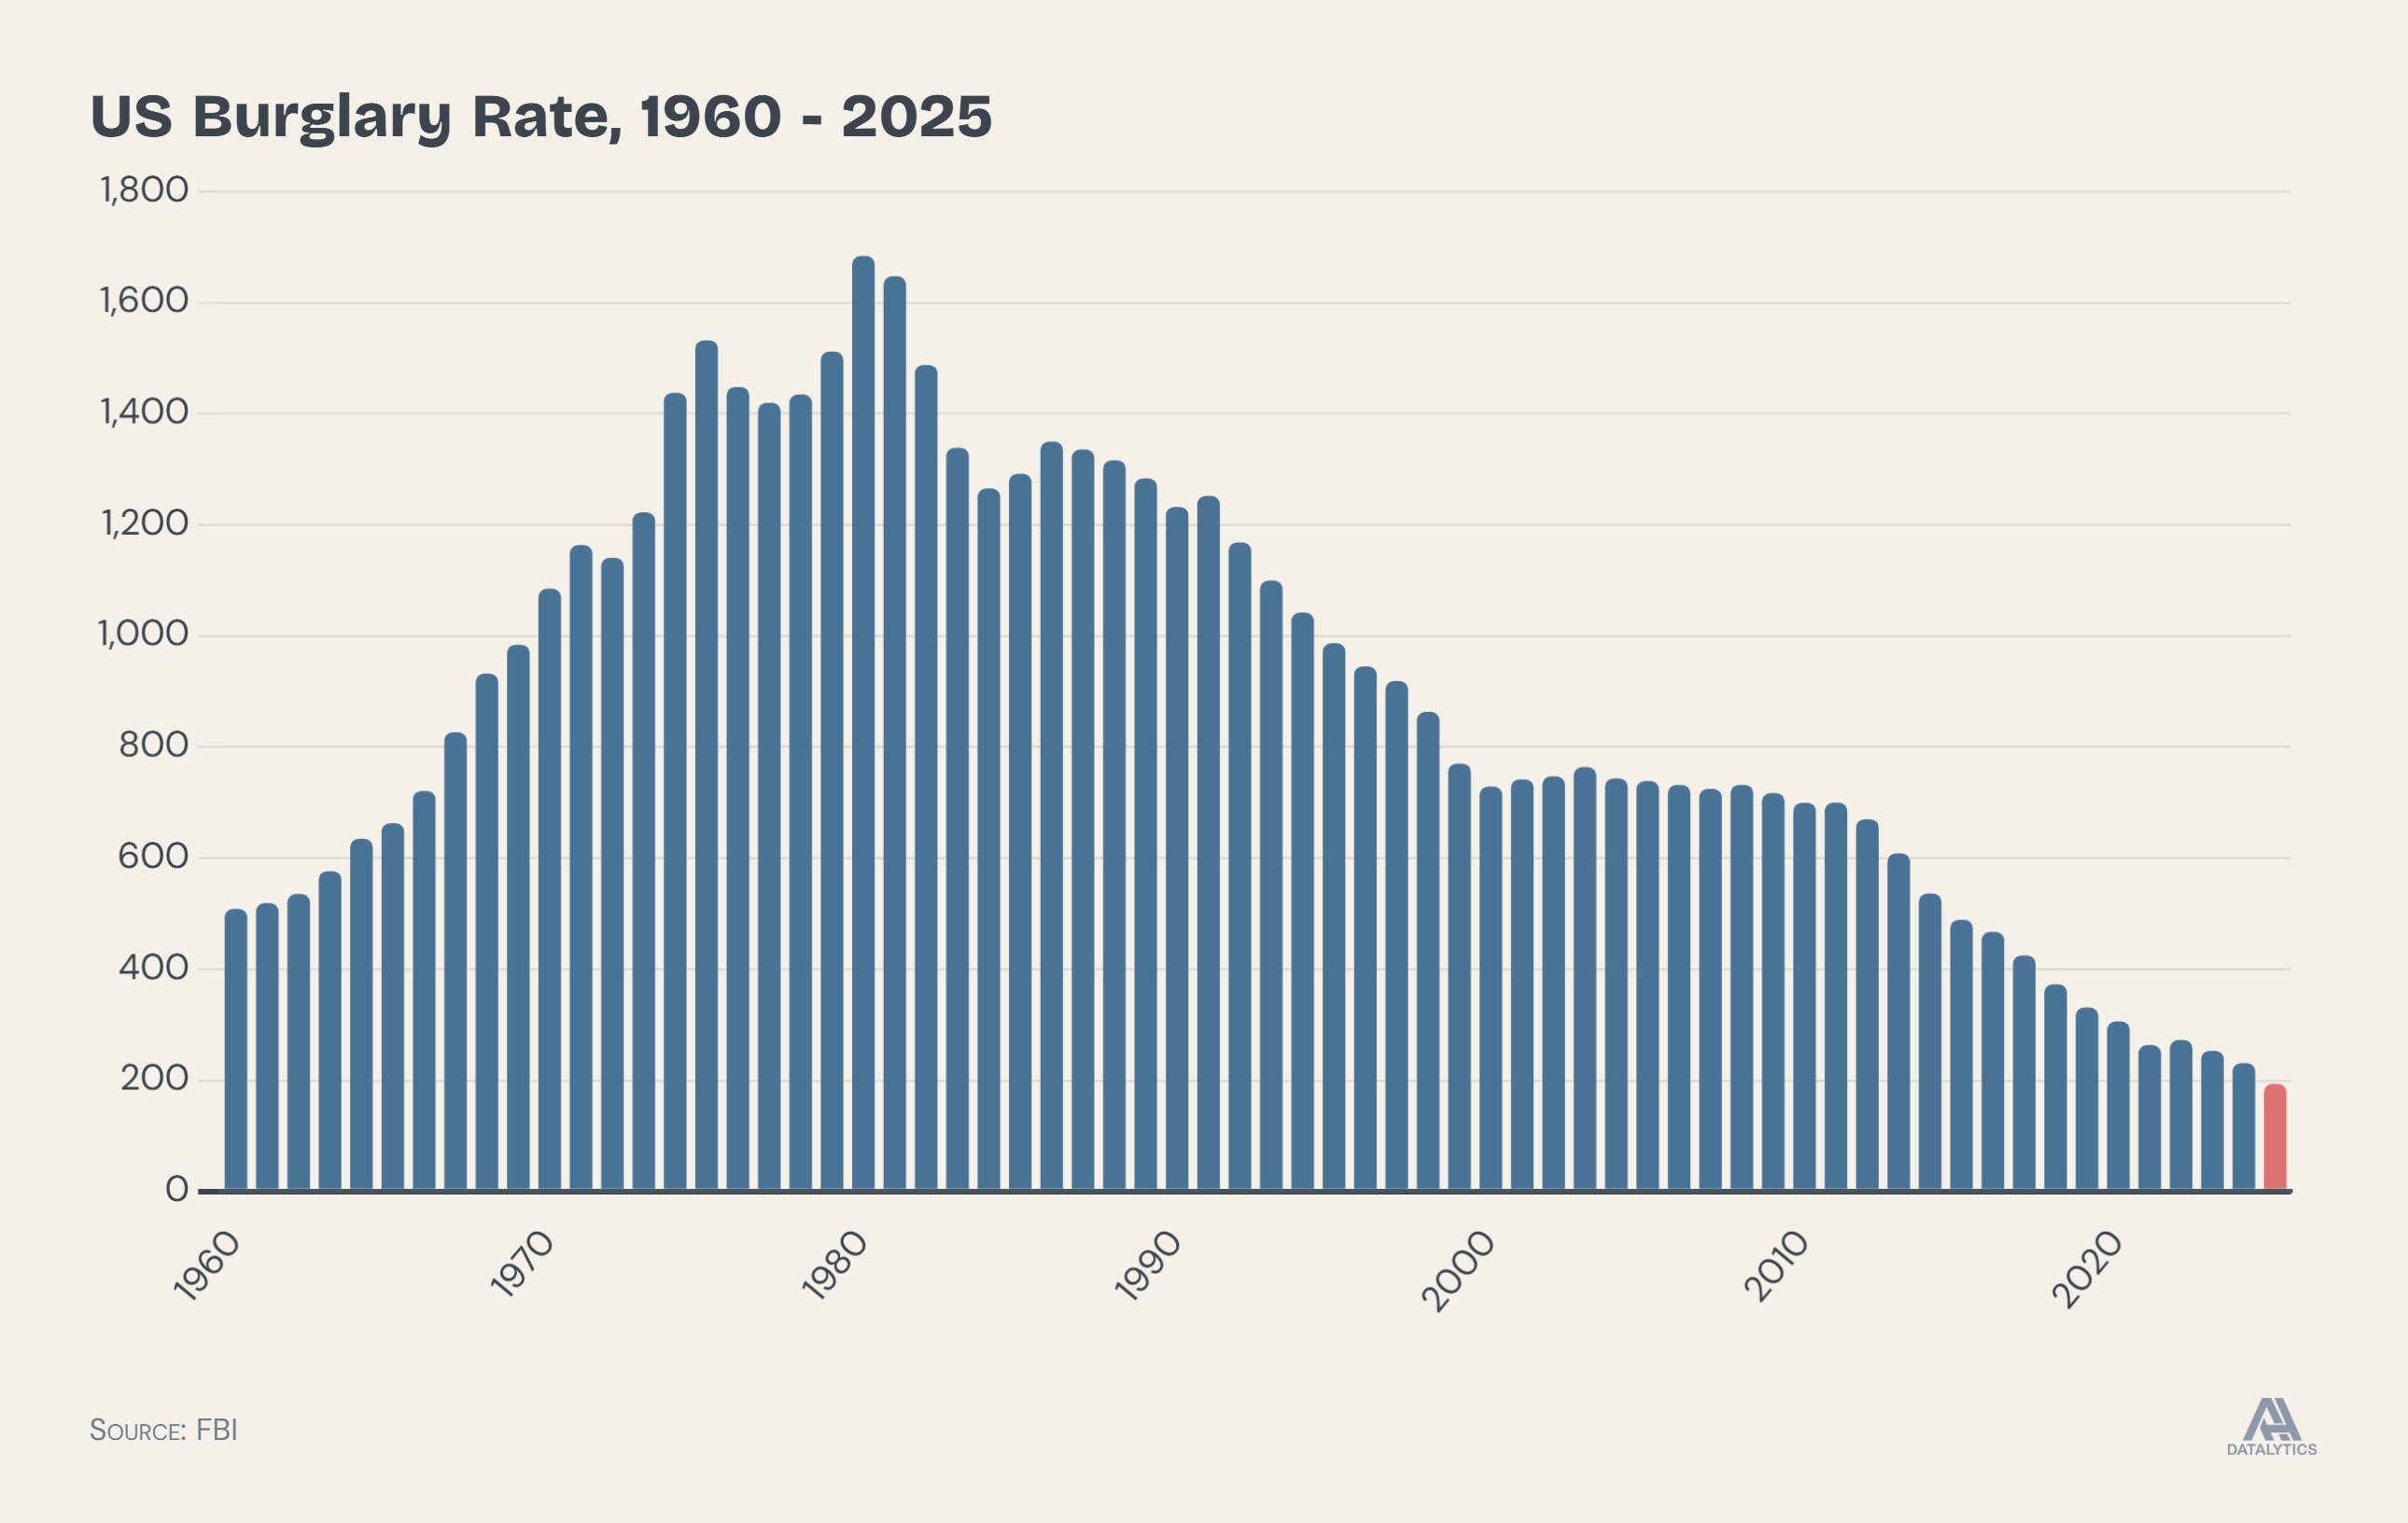
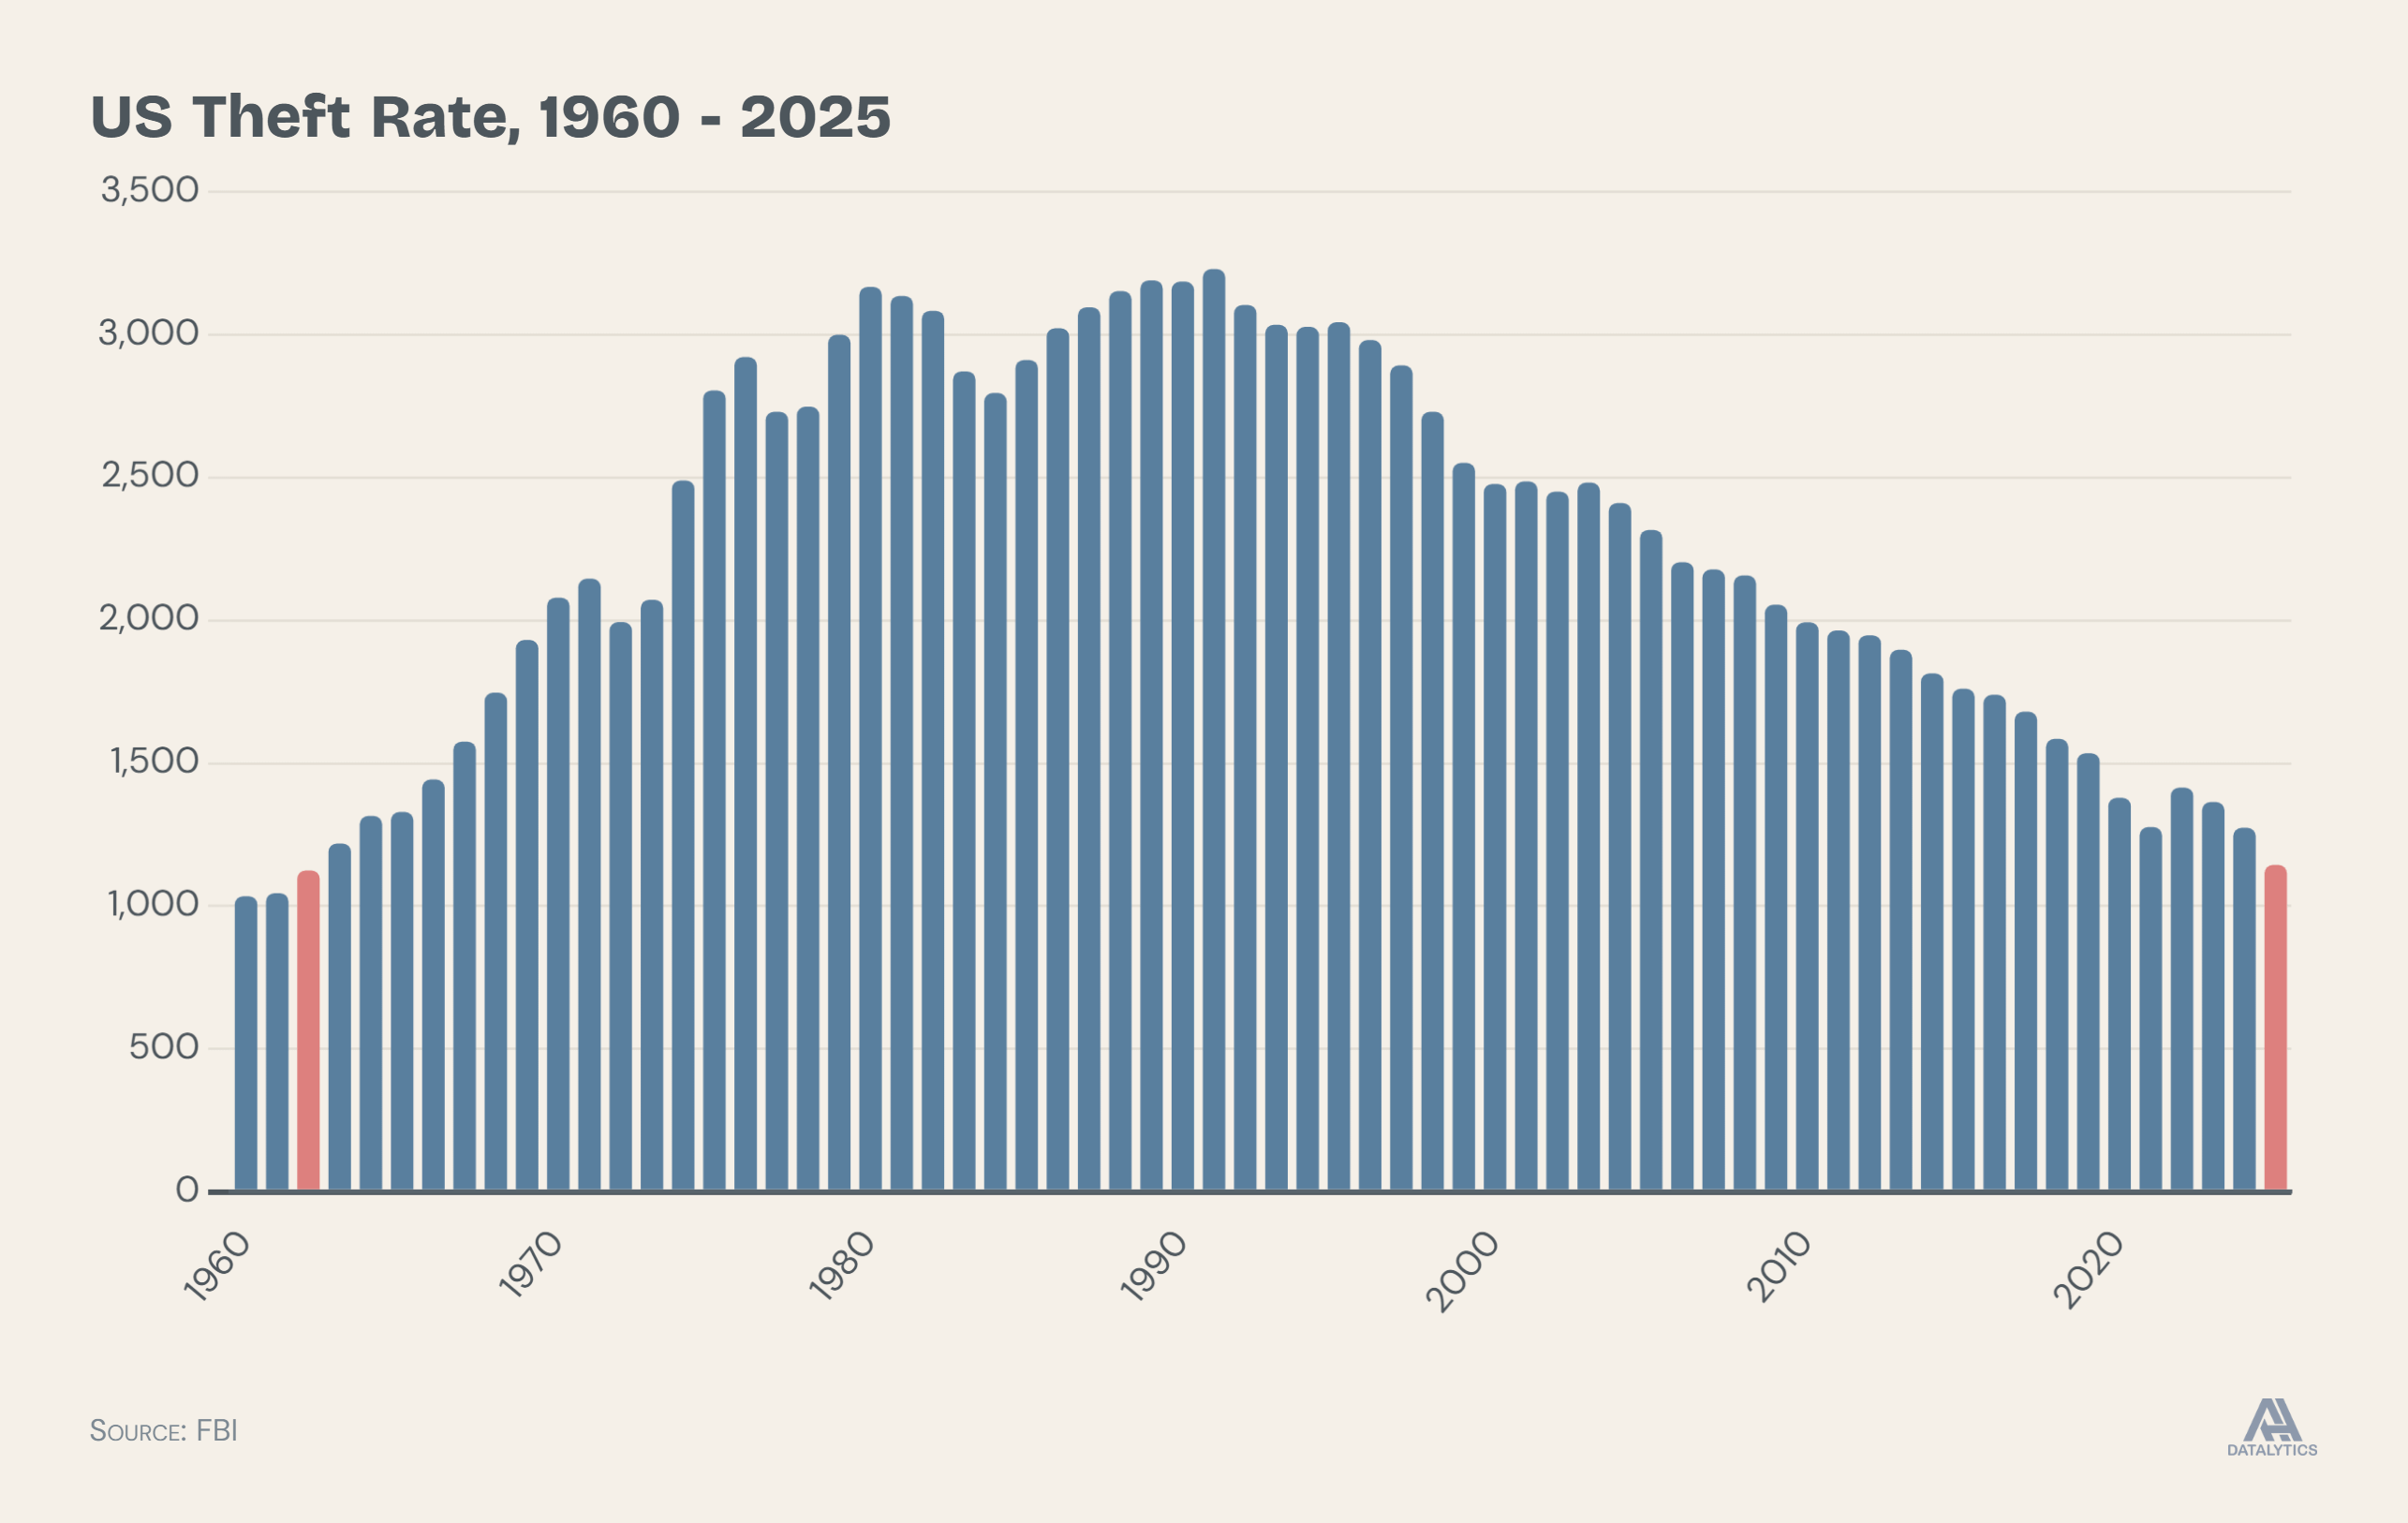
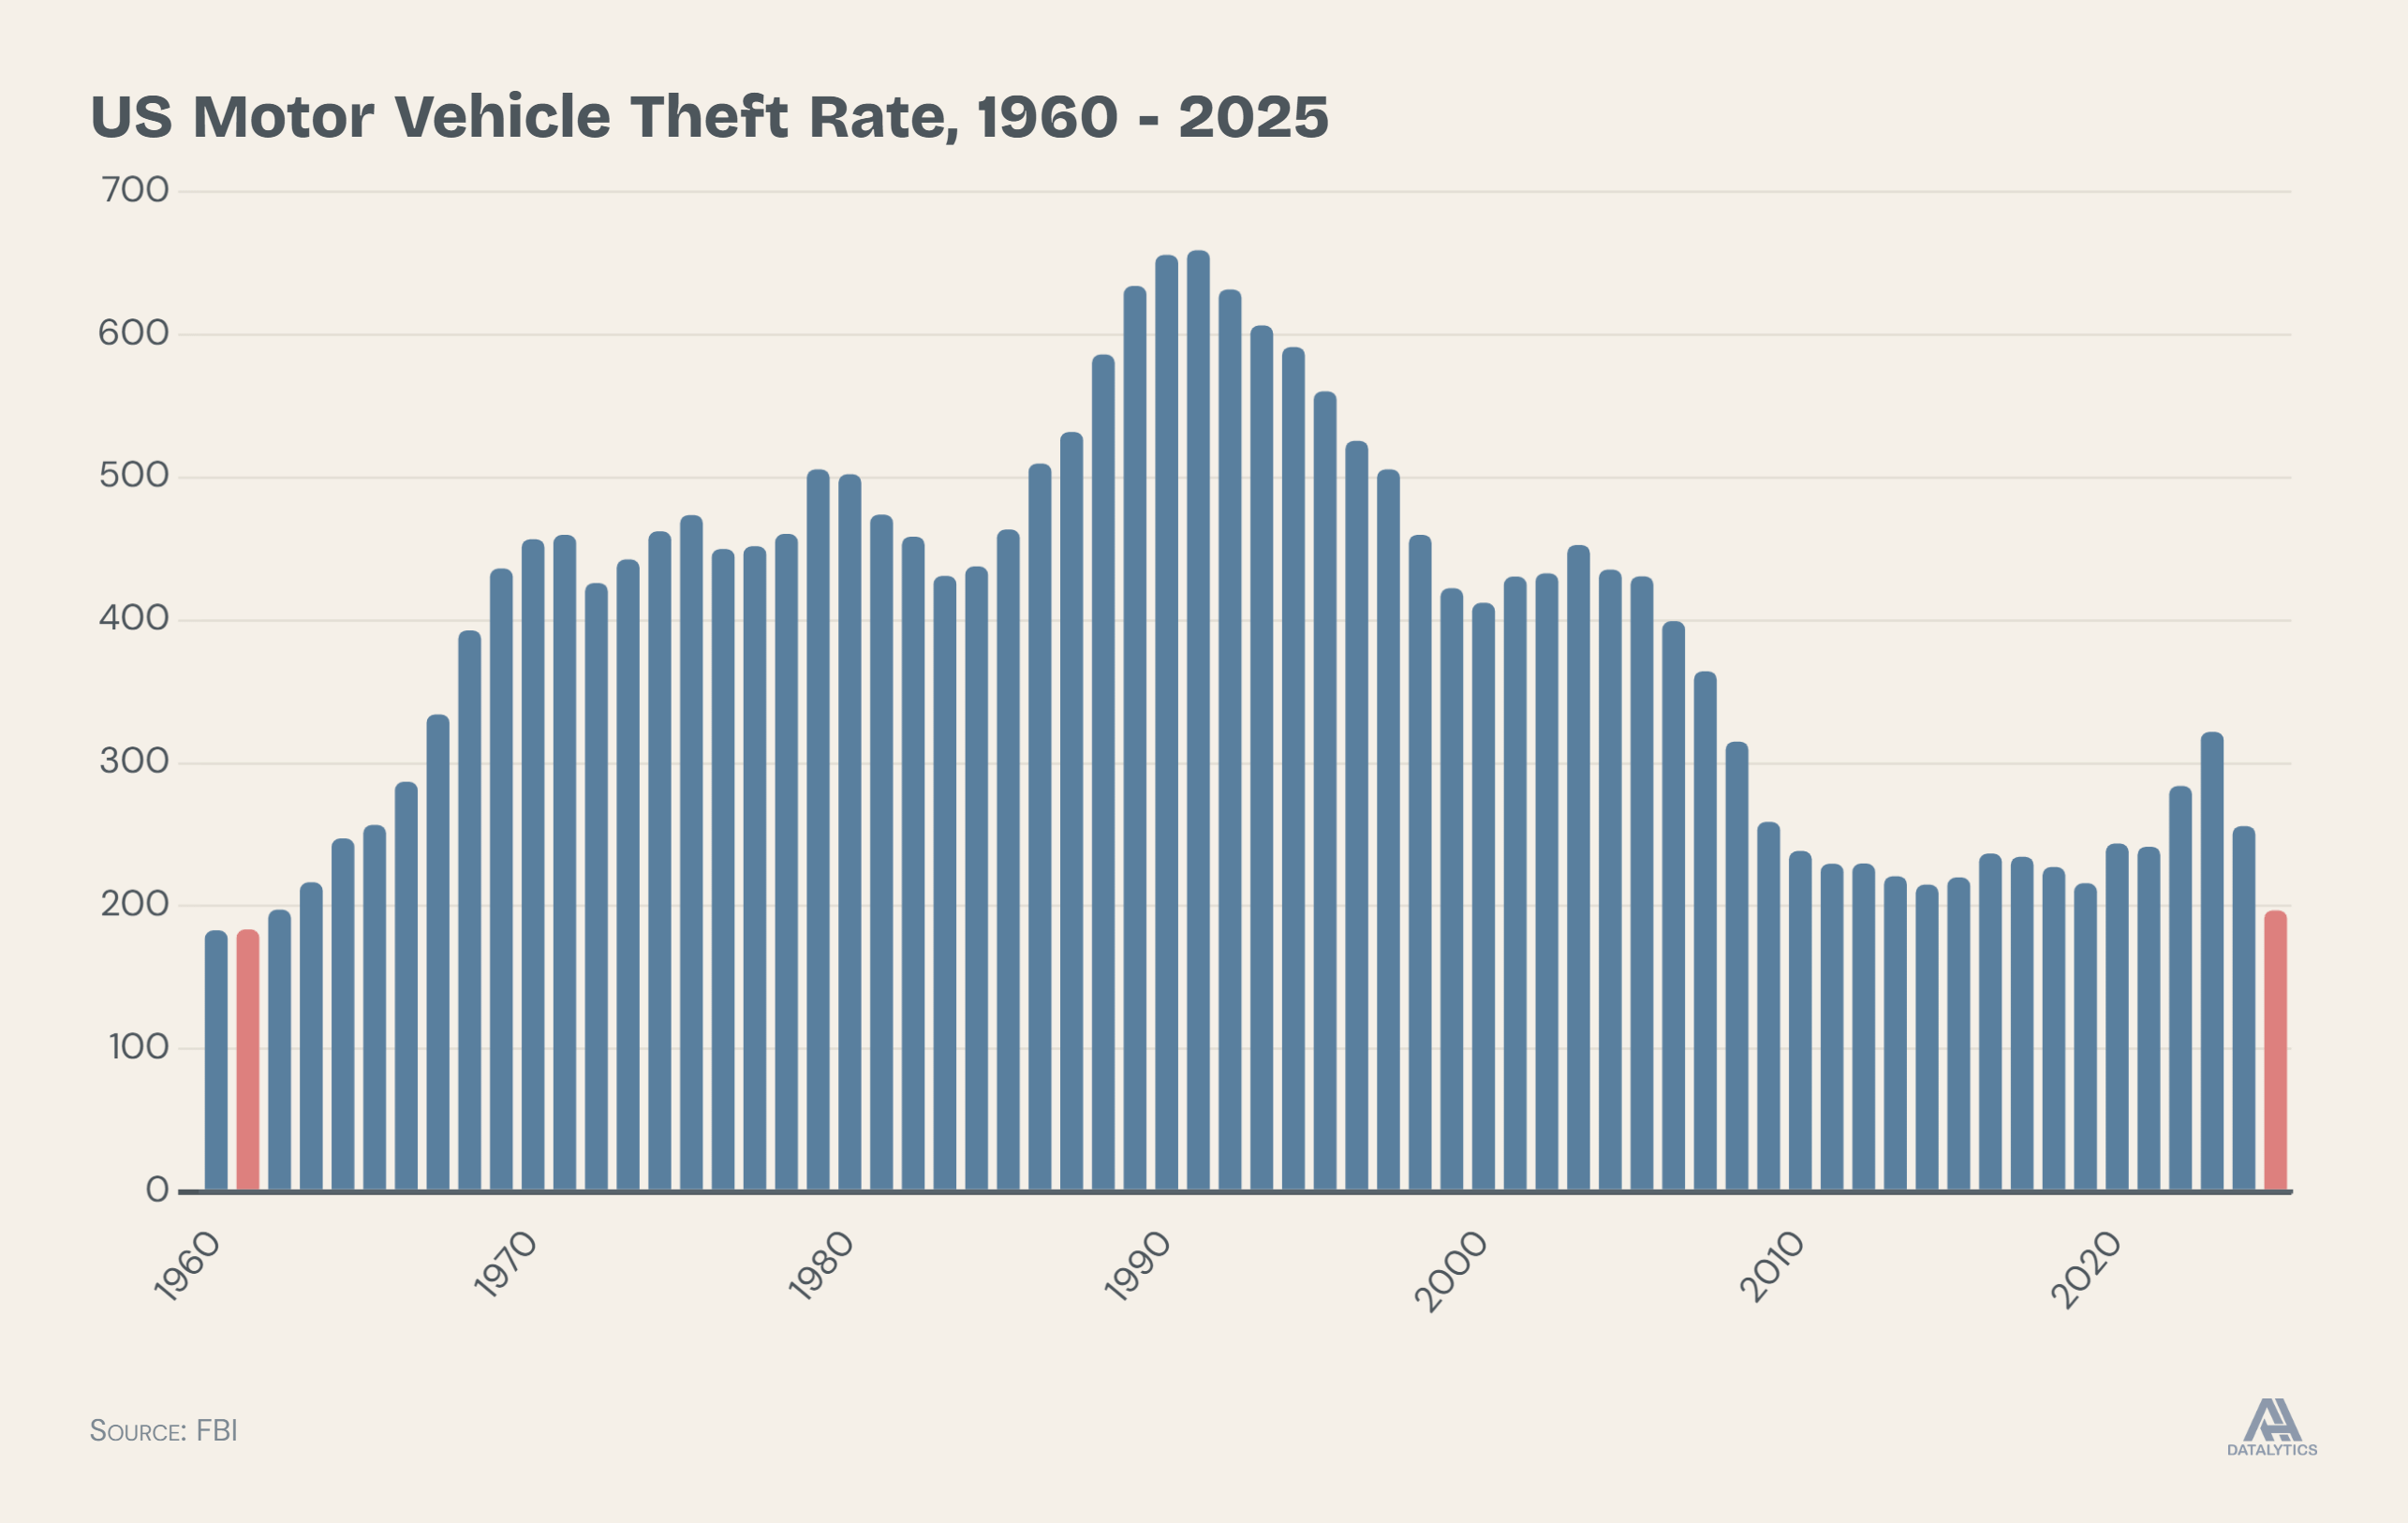
There’s another way to visualize how far things have come though — bar charts. I think it is helpful to look at the crimes that have fallen the most over the last few years and truly see the change through the magic of bar charts. To do that, I highlighted 2025 as well as the last time each crime’s rate was as low as it was in 2025.
Here’s violent crime, lowest since 1968:
The murder rate, lowest since at least 1960:
Robbery, also the lowest since at least 1960:
The property crime, lowest since at least 1960:
The burglary rate, lowest since at least 1960:
The lowest theft rate since 1962:
And the lowest motor vehicle theft rate since 1961:
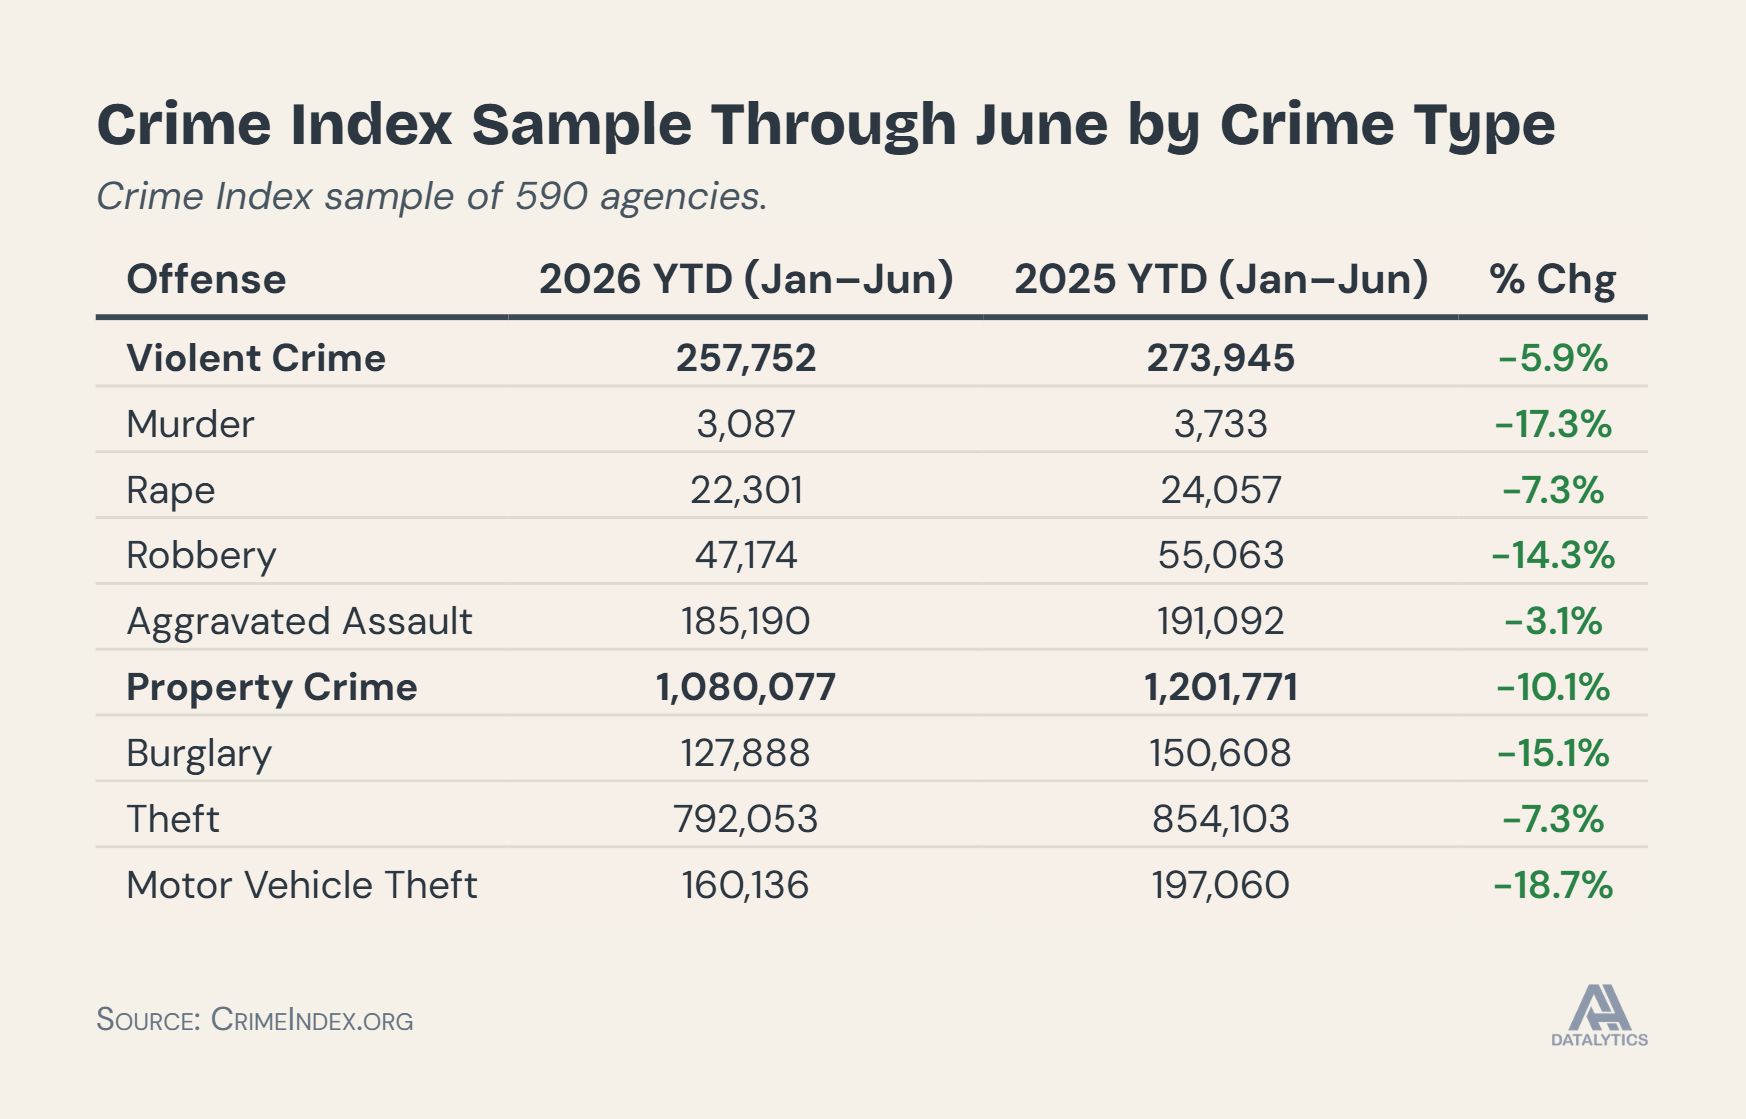
All available evidence points to another large drop in nearly every crime type occurring in 2026. The recently released Crime Index sample of 590 agencies has murder down 17 percent, violent crime down 6 percent and property crime down 10 percent through June 2026.
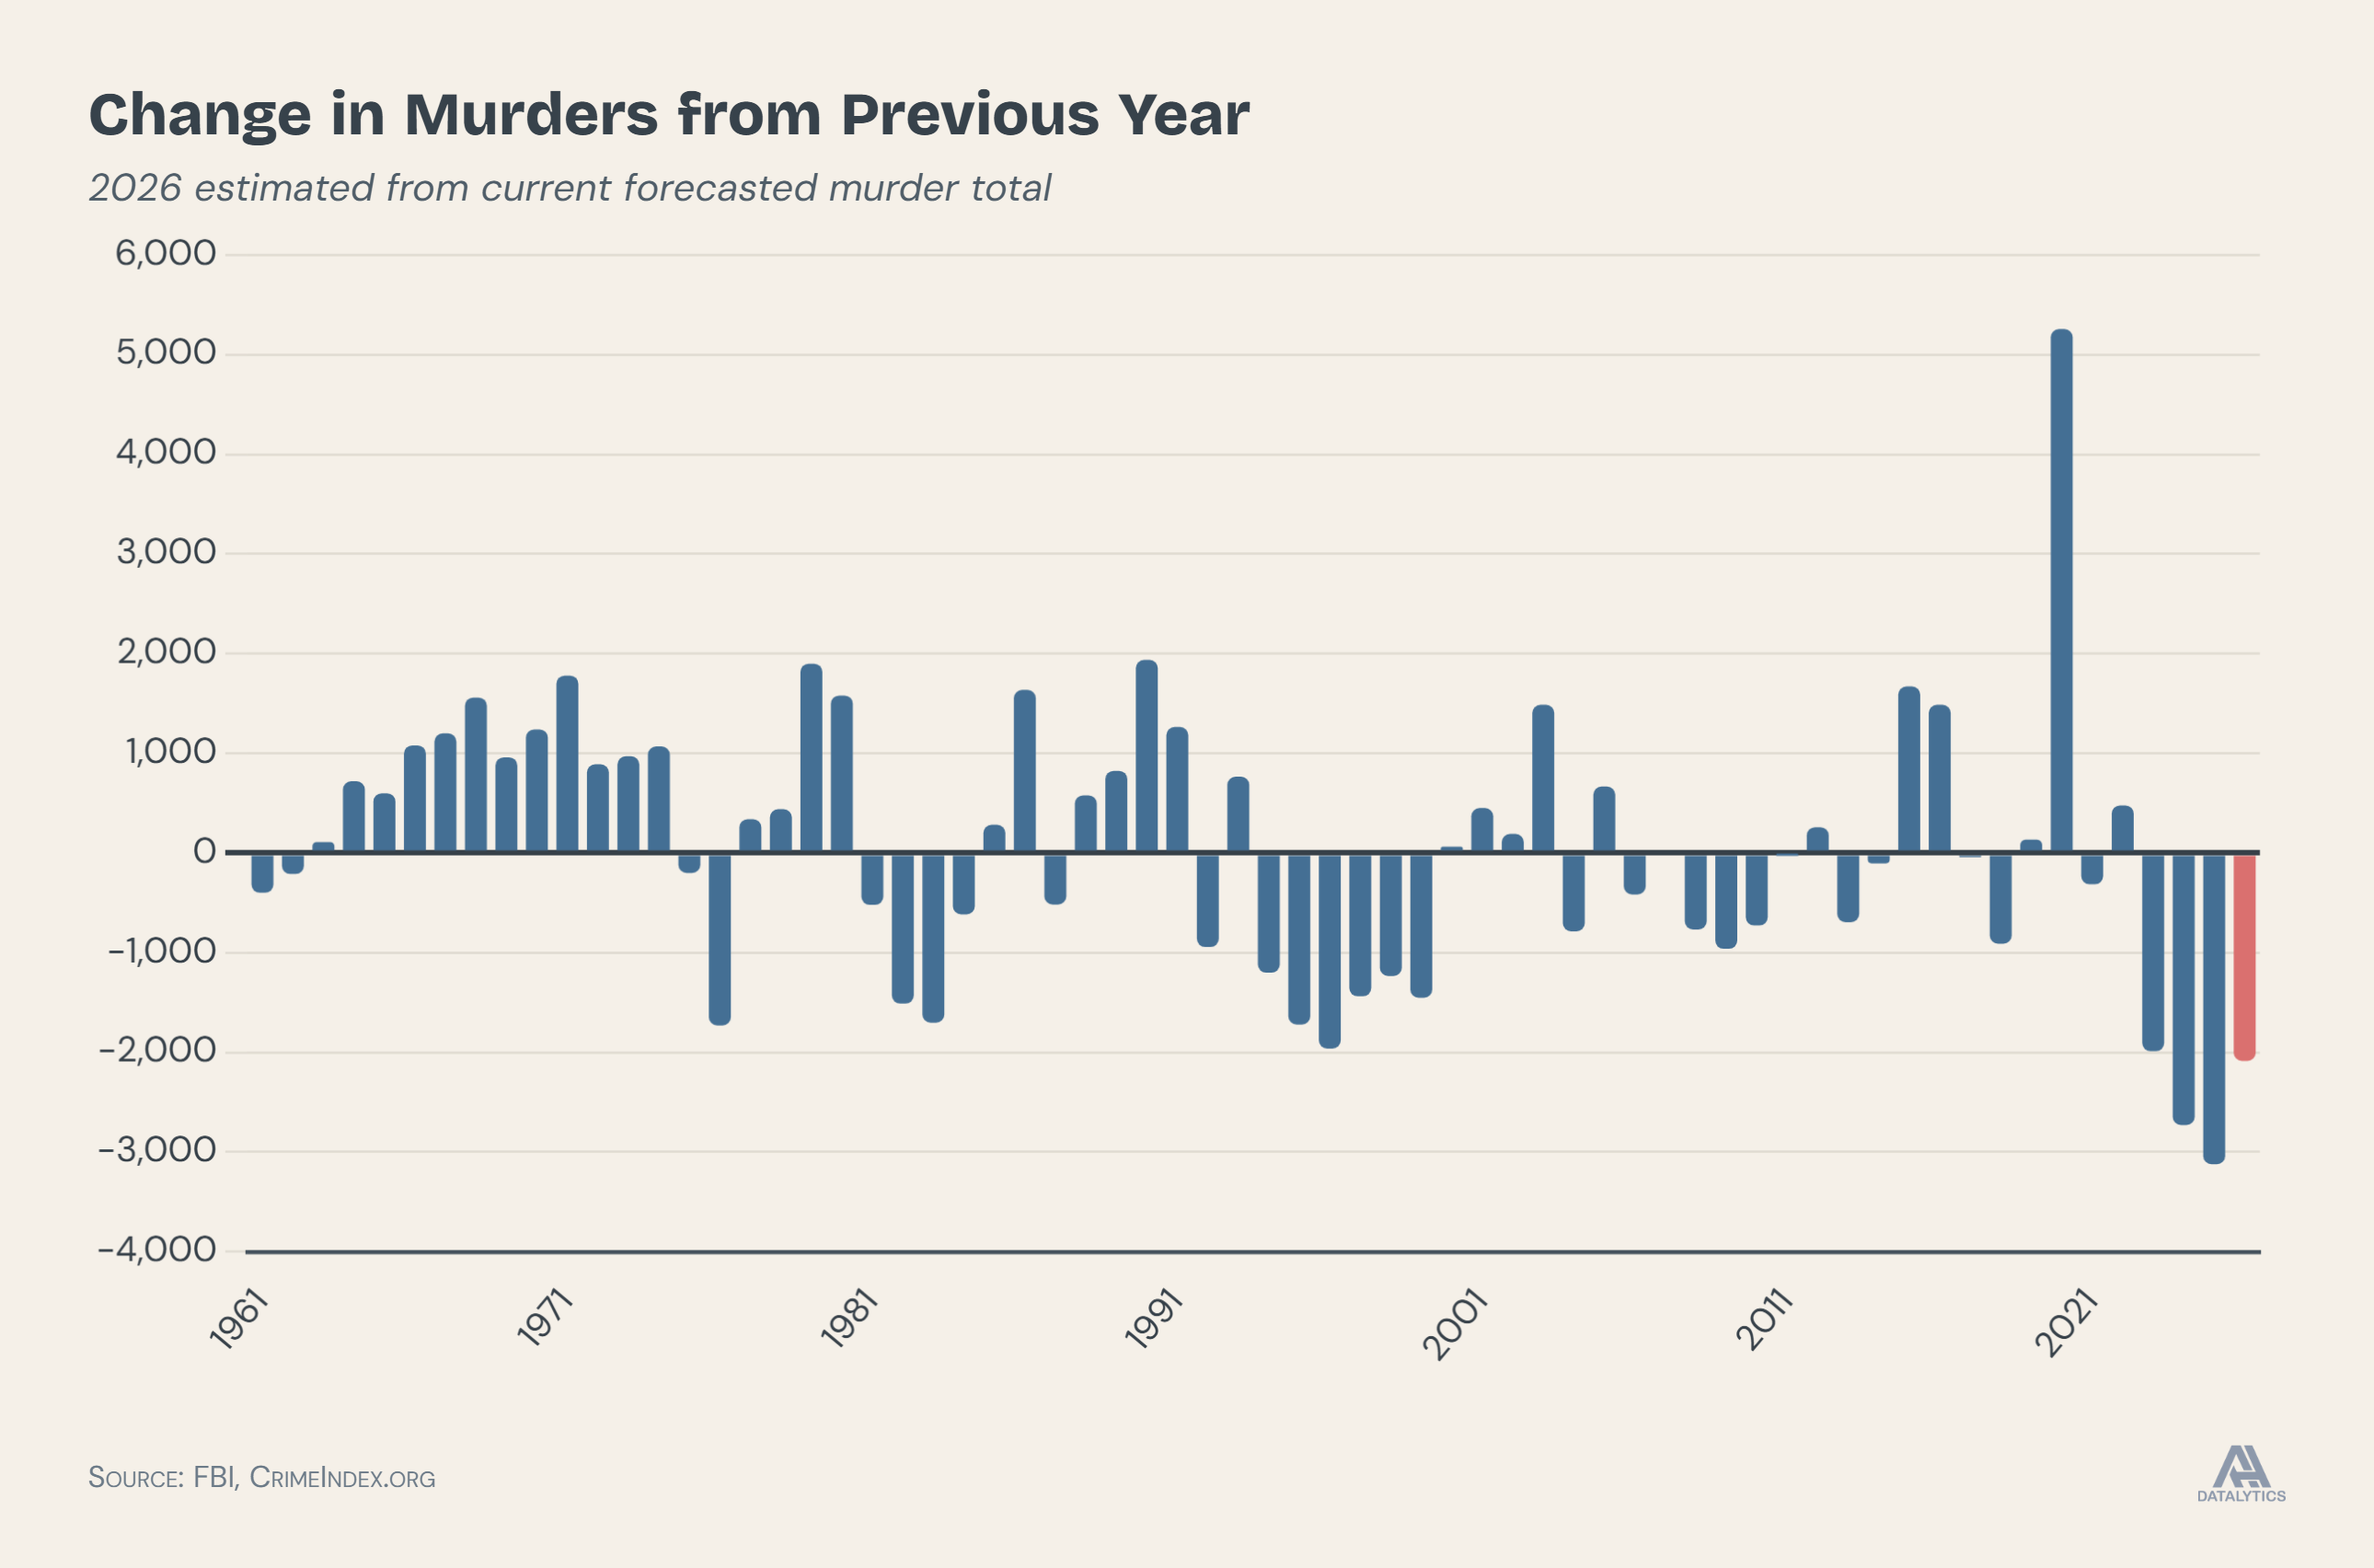
This year is on track to be the fourth straight year with a double-digit percentage point drop in murder. It may not set a new record, but the drop in murder this year will likely exceed any year prior to 2023 in terms of the largest drop in murders from one year to the next.
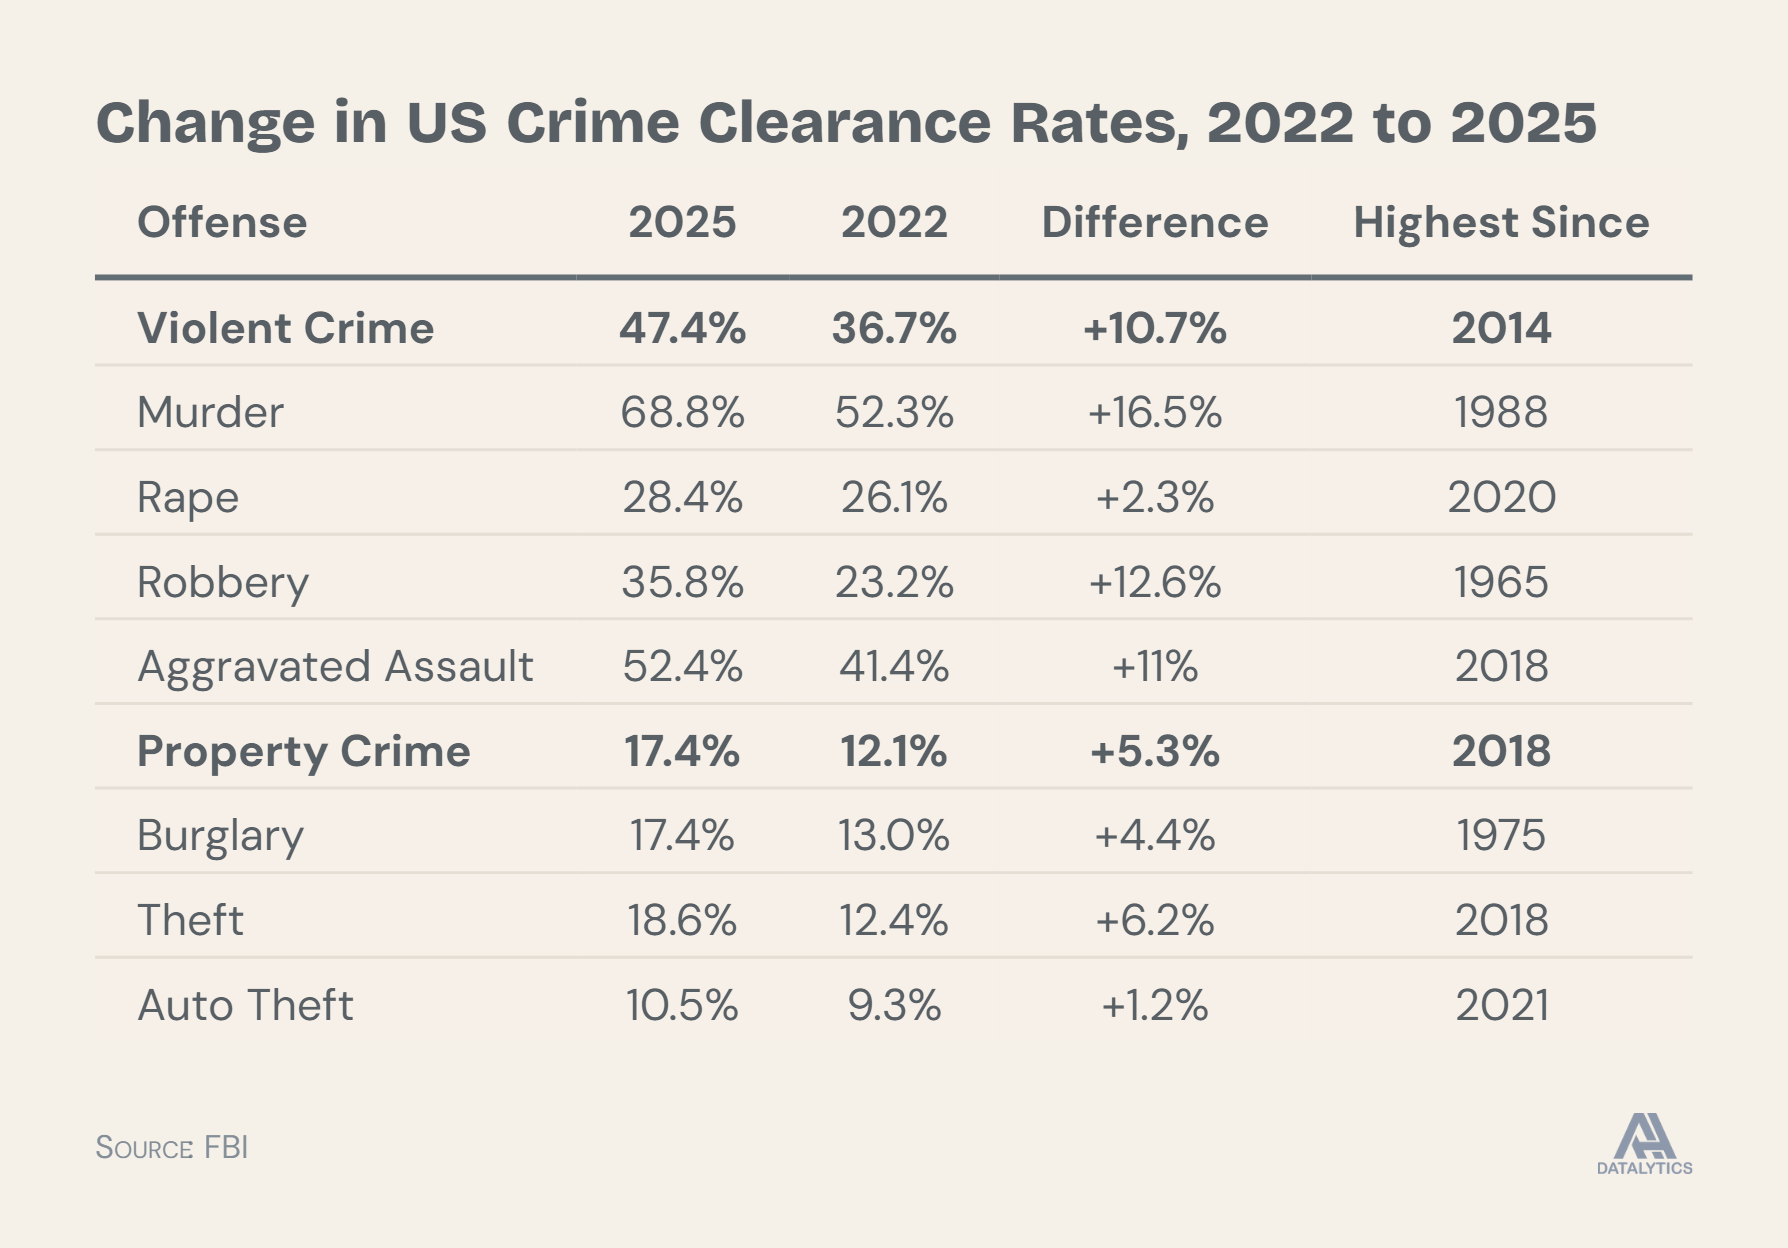
Finally, I have to point out that clearance rates for murder, robbery and burglary were the highest in decades. The robbery clearance rate interests me a ton given that the 1960s clearance rates aren’t particularly reliable.
Summing things up, I would say that 2023, 2024 and 2025 were all historic in terms of declining crime and 2026 is looking like it will be another historic year. Sometimes all it takes to see history is a couple of bar charts (with some tables sprinkled in).
New on the Jeff-alytics Podcast
The criminal justice system is big, it is complicated, and it is expensive. But how do we know what parts of it, if any, are working? Enter Mike Mueller-Smith.
A decade ago, Mike started building the Criminal Justice Administrative Records System (CJARS) a data infrastructure project that links criminal justice records across 40 states to employment outcomes, health data, and more. It is the kind of tool that makes you wonder why it didn’t exist sooner.
In this episode, we get into why criminal justice data is so fragmented, what it takes to stitch it together, and what researchers keep finding once they can actually see the full picture. We also talk about Mike’s Justice Outcome Explorer, which one of my favorite criminal justice data sites out there, a public dashboard built to help average Joes make sense of complex and sensitive criminal justice data.
You can also catch it on the Jeff-alytics YouTube page where I’ll be posting episodes and video clips, so be sure to like and subscribe there if you’re so inclined!
And while you’re here, be sure to check out these other recent great episodes:
Former ATF COO Thomas Chittum
Northwestern sociologist Andrew Papachristos
Vera President Insha Rahman
Director, NORC Center on Public Safety & Justice John Roman
Thanks Jeff. Your contribution is valuable and you're gaining traction - I see you cited more often in news articles.
The charts are helpful to show to crime-fearin' friends/relatives who don't understand numbers. They need to be required viewing for a certain unnamed fear-mongering political party and the LameStream media.
This really makes me wonder what happened in the late 60s and early 70s? Seems like it doesn't get discussed enough.