New Orleans Had The Nation's Highest Murder Rate in 2022
On the pitfalls of comparing murder rates between cities, why it's still worthwhile, and a look ahead to New Orleans in 2023.
2022 has been a grim year for gun violence in New Orleans. There have been 261 murders so far through the early morning hours of December 26, the most here since before Katrina. The city’s murder rate is on pace — with a few days left — to eclipse 70 per 100k for the first time when the city had 250k or more people in it since 19961 . There were 37 women murdered in New Orleans in 2022, and while most murder victims were men that was still the highest number of women killed in a year here since 1996.
New Orleans almost certainly had the highest murder rate of any big city2 in 2022, the first time leading the nation in murder rate since 2011. But we must be careful when comparing murder rates across cities because the method used to calculate each city’s murder rate is somewhat subjective.
The Pitfalls of Comparing Murder Rates
Comparing murder rates between cities can be tricky because the task requires choices in terms of city borders and sourcing that complicate the picture. Each city’s borders contain a different share of a metropolitan area's overall population meaning comparisons may not always be apples to apples.
St Louis, for example, is a metro area with nearly 3 million people, but the City of St Louis is officially less than 300,000 people so only about 10 percent of the metro area is counted as part of the city. That makes the City of St Louis one of the smallest city populations relative to its metro area in the country.
The City of Baltimore’s population, by contrast, makes up about 21 percent of the metro area and the City of New Orleans’s population makes up about 31 percent of the metro area. Including a larger or smaller share of each city’s metro area in the murder rate denominator alters each city’s rate quite a bit.
The process of comparing murder rates is further complicated by needing different sources for city populations to build the rate. The switch to NIBRS means many cities are not reporting data to the FBI — including cities with high murder rates such as New Orleans and Baltimore.
It would be preferred to uniformly use the FBI’s 2021 estimated population, but that doesn’t work for cities that did not submit data to the FBI. One can substitute in the 2021 Census estimates for cities that did not report to NIBRS. The Census estimates should be similar, but not inherently identical, to what the FBI would estimate.
The FBI has a disclaimer on its website precisely because of these issues. The disclaimer tells readers that they “should take into consideration relevant factors in addition to an area’s crime statistics when making any valid comparisons of crime among different locales.”
And yet I do think it can be useful to compare murder rates while being aware of the above limitations. Examining murder rates over time provides a way to measure a city’s progress or lack thereof relative to other similar cities. This process also calls attention to both successes and failures by cities to address gun violence.
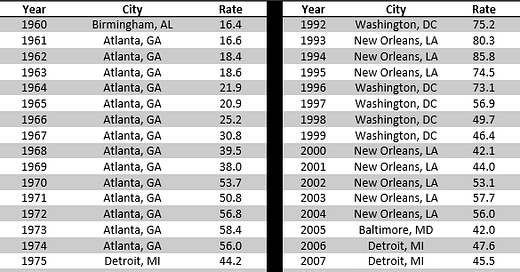
Indeed, the below table of the city with the highest murder rate each year since 1960 tells a complex story. Washington DC, for example, had the nation’s highest murder rate 9 times between 1988 and 1999 but has not since as murders fell dramatically there over the span of 30 years. New Orleans, by contrast, had the nation’s highest murder rate 12 times between 1993 and 20113 but had generally lower murder counts until 2020 at least partially in response to a gun violence reduction strategy implemented in 2012. Then there’s Miami in the early 1980s, Detroit in the mid 1980s, and St Louis since 2014.
2022 Murder Rates
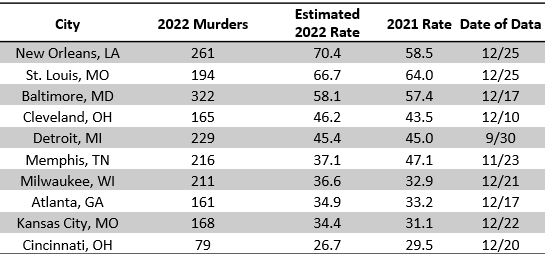
New Orleans is not yet NIBRS compliant and won’t submit data to the FBI again for 2022, but publicly available data from high murder cities shows that New Orleans almost certainly had the nation’s highest rate this year. St Louis is on track for a murder rate of roughly 67 per 100k and Baltimore is on pace for about 58 per 100k.
Some high murder cities like Detroit and Memphis don’t regularly report murder totals, but available data shows both cities on track for lower murder rates in 2022 than New Orleans (Detroit data through September via Major Chiefs, Memphis data via media report from late November). Other cities with high murder rates like Cleveland and Milwaukee publish weekly crime statistics updates4.
The below table shows the estimated murder rate in 2022 for the 10 cities that had the highest murder rates in 2021. Murder rates for 2022 were calculated based on each city’s pace of murders at the last date of available data.
New Orleans clearly has the highest rate of murder of any one of these cities, but each city on the above list has sufficiently high gun violence and the murder rates in New Orleans, St Louis, and Baltimore are particularly abysmal. Conversely, the above list highlights just how much worse gun violence has gotten in a place like New Orleans over the last few years and how far the city has fallen since 2019 when there were 121 murders and a murder rate of 30 per 100k.
New Orleans in 2023
The less bad news is that there are reasons to believe that murder could fall in New Orleans in 2023 if gun violence stays at roughly the same level that the city has endured since mid-2020. The main reason to suspect a drop in murder next year is due to improved luck/randomness.
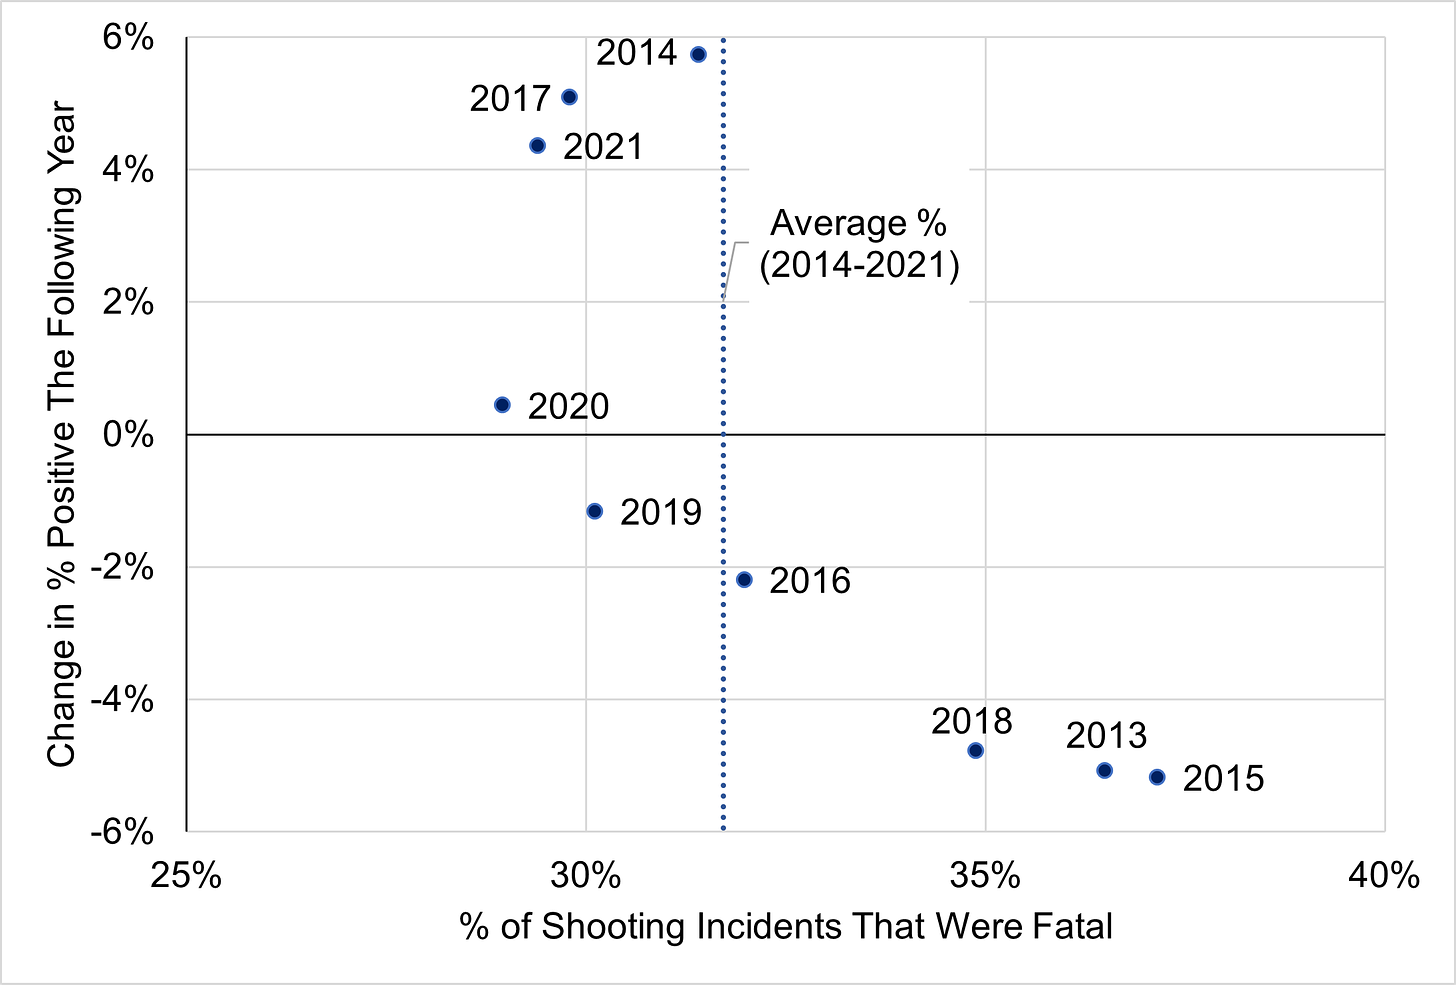
There have been over 4,500 shooting incidents in New Orleans since 2014 and 31.7 percent of them have been fatal where at least one victim died. This percentage jumps around from year to year though it has tended to revert back towards roughly 32 percent over time (I wrote about this issue for FiveThirtyEight many moons ago).
As you can see on the graph below, years where the percent of shootings that were fatal was below average (to the left of the dotted line) have been usually followed by a higher percent fatal the next year and vice versa.

Nearly 34 percent of shootings this year have been fatal, about two percentage points above normal. Logic suggests that more reversion to the mean may occur next year which would mean fewer murders at roughly the same number of shootings.
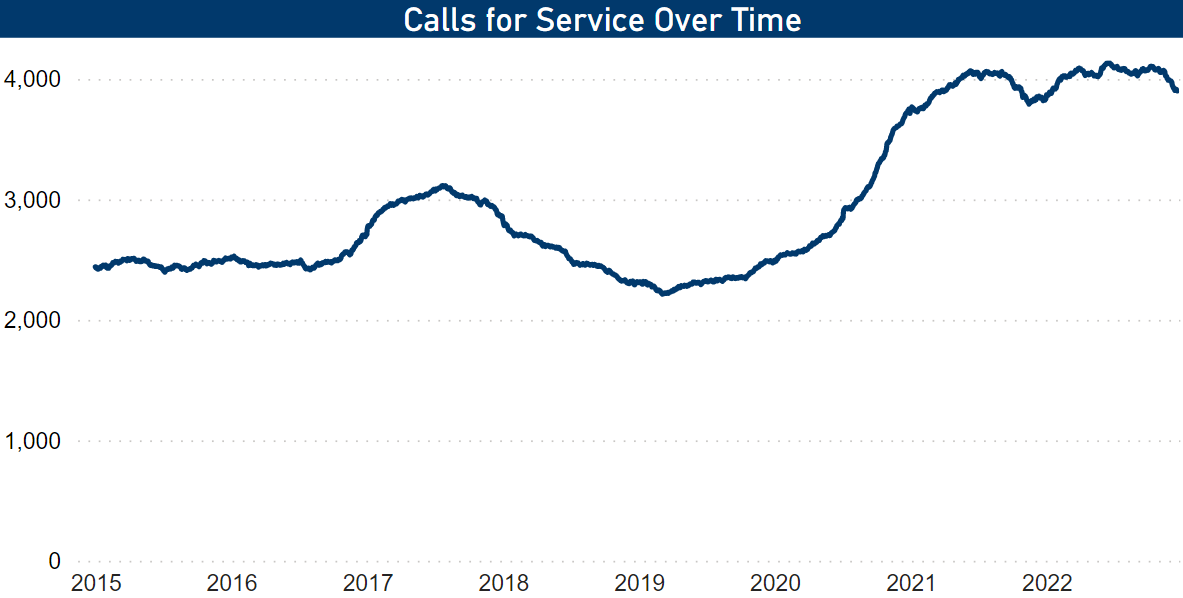
Shootings in New Orleans have been consistent at roughly 2 shootings per day since mid-2020. But there is some evidence from NOPD’s Calls for Service repository suggesting a slowdown may be coming.
911 calls for firearm discharges generally serve as a decent leading indicator of where gun violence will go locally and these incidents have fallen slightly since the summer of 2022. Murder is up 22 percent and shootings are up 8 percent, but firearm discharge Calls for Service are about even or slightly down relative to this time last year. It is far from a certainty, but it would not be surprising to see fewer shootings next year given the trend of fewer firearm discharge 911 calls over the last few months.

Finally, it would make sense for New Orleans gun violence to match the national trend of declining gun violence. There is precedence for New Orleans being a bit late to follow a national decline. Murder peaked nationally in 1991 but it did not peak in New Orleans until 1994. Of the 30 cities with the most murders in 1990, 6 peaked in 1990, 10 peaked in 1991, 10 peaked in 1992 or 1993, and 3 others — including New Orleans — peaked in 1994.
Whatever complex collection of factors behind the apparent nationwide decline in gun violence are not yet driving shootings and murders down in New Orleans. But there is no reason that those factors can’t inherently drive shootings lower in New Orleans some time in the coming years.
They just haven’t yet.
Maybe next year.
This excludes 2006/2007 when the city’s smaller post-Katrina population led to wild fluctuations in the murder rate.
250,000 or more people.
New Orleans did not have 250,000 or more people after Hurricane Katrina in 2006 and 2007 otherwise it would qualify on this list as having the nation’s highest.
Other cities like Jackson, MS and Gary, IN may have higher murder rates — data isn’t available for either city — but they are considerably smaller cities so aren’t being included in this analysis.


