
Re-Evaluating Washington DC's Crime Trends
A preliminary look at crime trends in DC.

Have you listened to the first episode of the Jeff-alytics podcast with Michael Lewis yet? It’s fun and entertaining so check it out on Spotify, Apple, Amazon, I Heart, or wherever you get your podcast! Be sure to subscribe to catch next week’s chat with Laura Arnold of Arnold Ventures when it comes out. Now onto this week’s newsletter.
I have four small kids at home, so I get asked a LOT of questions over the course of any given day. As such, it comes as no surprise that the common question I’ve been asked over the last two months is “can we watch TV?”. But the second most common question I’ve been asked since mid-August has been some variation of “what effect has the deployment of the National Guard and other federal law enforcement officers had on DC crime?”
My answer, pretty much every time, has been “it’s too soon to say much with confidence.” My answer is more or less the same now that we are through September and into October, but I guess enough time has passed that we can take a preliminary look.
Trying to answer to the question is actually instructive into some pitfalls eith analyzing crime data. Crime trends can change suddenly for complex reasons that are not well understood, and a long timeframe is usually needed to separate trend from random variations.
Analyzing trends is even more difficult when an intervention intended to lower crime occurs at a time when crime is already falling — both locally and nationally. How does one tease out the impact of the intervention versus a continuation of the pre-existing trend? If we’re being honest, it’s not easy.
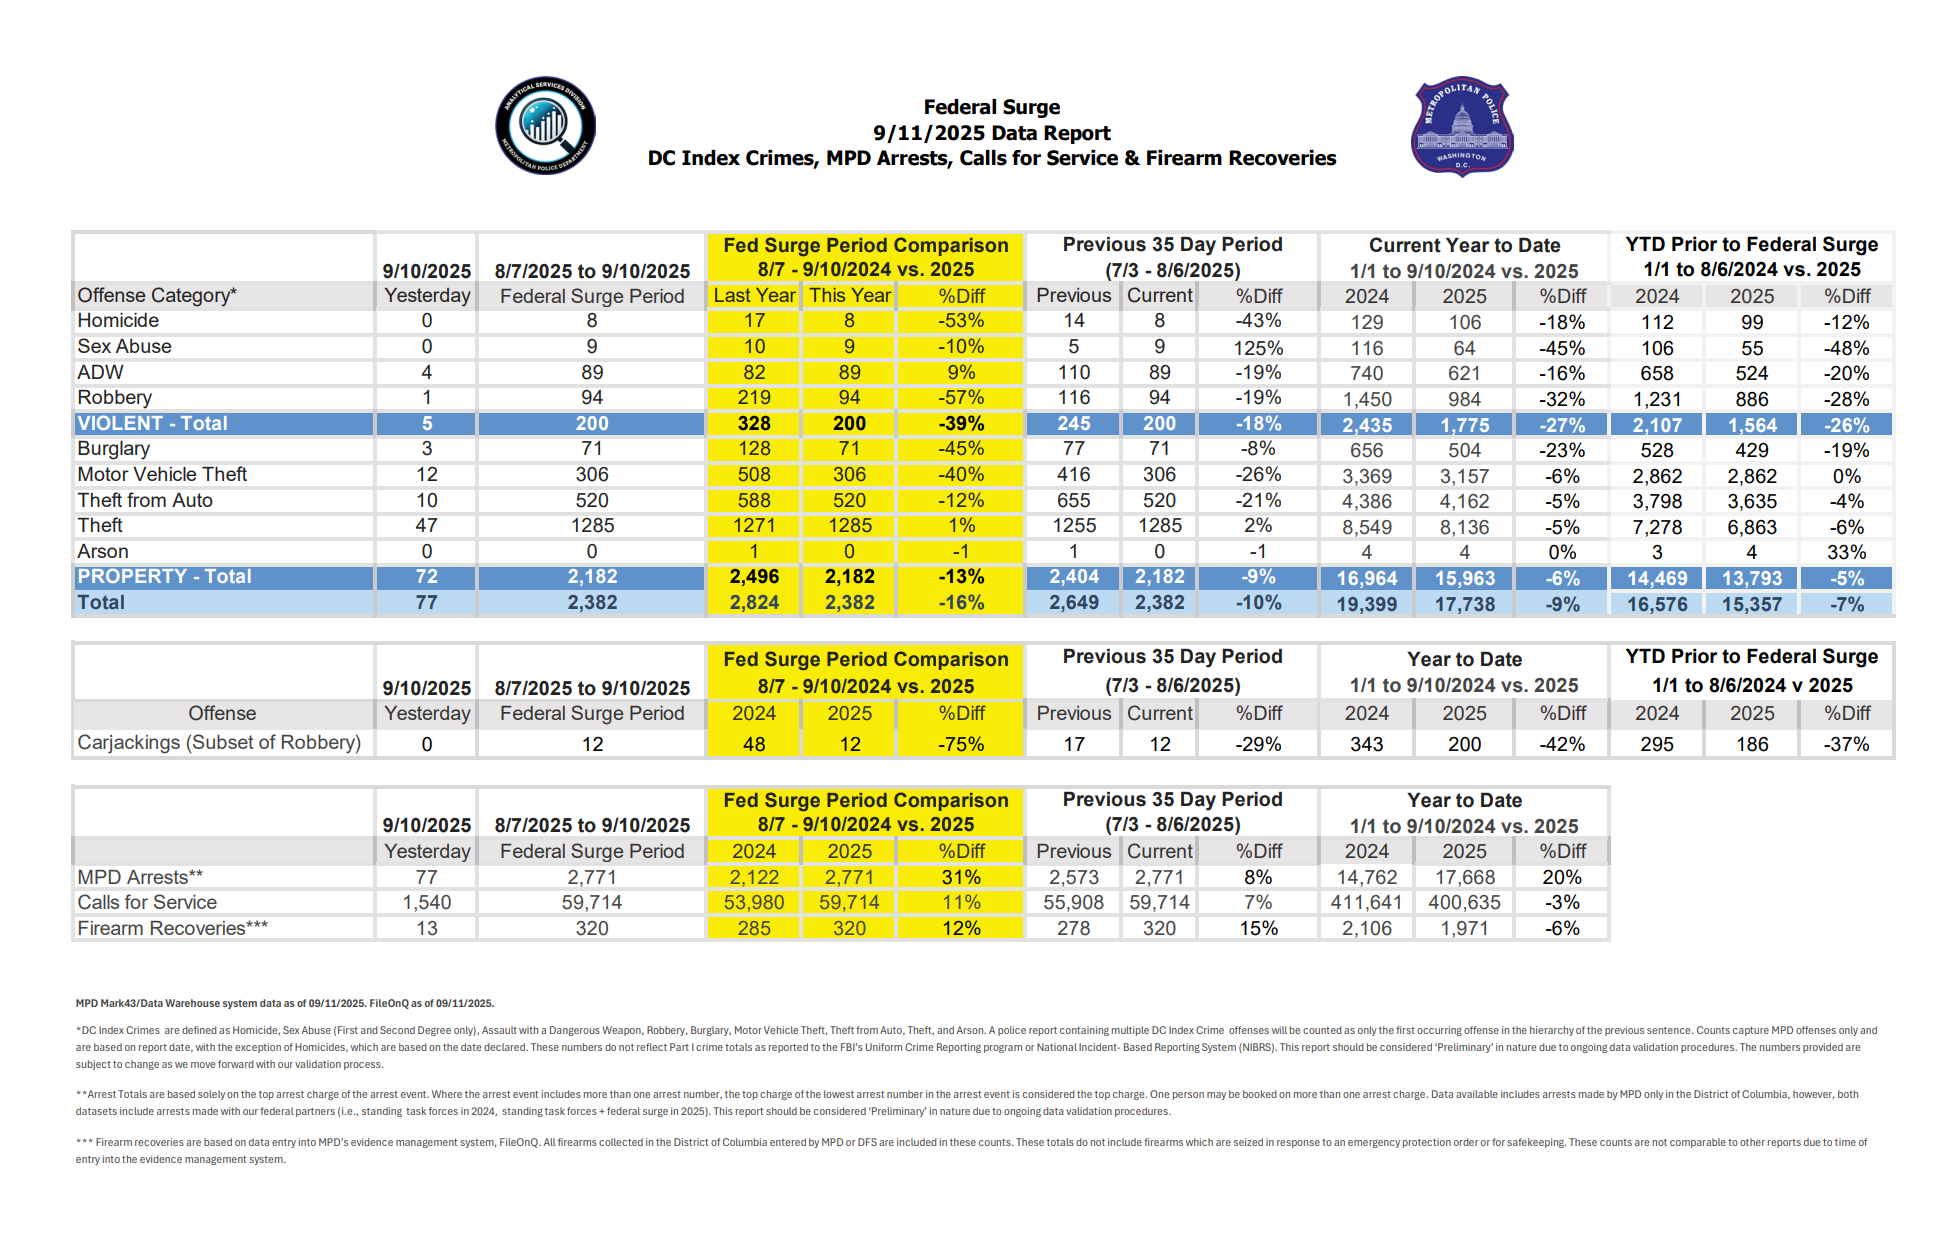
In my opinion, there’s a right way and a wrong way to evaluate whether crime trends are changing due to an event or intervention. This, in my opinion, is the wrong way:
I think that using Year-to-Date statistics can be useful, especially if you’re aggregating trends from a large sample of agencies or it’s late enough in the year and you’re comparing 9 or 10 months of this year to 9 or 10 months in past years. For a good read on the issue with relying on YTD at an agency-level I always recommend Jerry Ratcliffe’s terrific piece entitled “Year-to-date comparisons and why we should stop doing them” which lives up to its title.
Year-to-date changes often say as much as what happened last year as they do this year. As such, using YTD or period-to-date to compare a 3 week or 2 month stretch to the same timeframe last year or the preceding 3 weeks or 2 months is not a great idea. It provides no context to any actual changes and small shifts due to randomness can come across as large percent changes.
Violent crime in Washington DC was down 29 percent over the last 20 days of June compared to the 20 days that preceded it. Moreover, it was down 48 percent compared to the last 20 days of June in 2024!
What caused this impressive turnaround? Almost certainly the randomness of comparing changing crime patterns over a short period of time.
In my humble opinion, a far better way to see whether an event or intervention had an impact is to roll incidents over time. Each point on the line represents the total number of incidents over the last 30 days. For an extreme example, check out car thefts in Chicago before and after a video telling people how to steal certain models of Kias and Hyundais went on TikTok (gray line).
And below you can see the impact of a new gun violence reduction program in New Orleans. The program began in late 2012 and picked up steam throughout 2013. The drop in shootings starts around April 2013 and continues for most of that year before losing steam. A longer rolling period (90 days in this case) helps to smooth out randomness though it can take longer to see a real trend developing.
Aside from using rolling counts, these two graphs highlight just how important having an ample amount of time after an event or intervention is to understanding its full impact. They also clearly show how critical the context of a place’s trends before an event or intervention is for evaluating the impact.
Crime, and especially violent crime, is falling in Washington, DC. The question isn’t whether it’s down over the last 6 weeks, it’s whether the deployment of the National Guard and other federal law enforcement to DC has accelerated the preexisting decline.
I still think that any definitive assessments are still premature in my opinion. But we have had more than six weeks since the deployment began, so I guess some preliminary thoughts can be committed to paper based on the initial data though.
Carjackings
Yes, carjackings were down a lot in August 2025 compared to August 2024. But they were down a lot in July 2025 compared to July 2024 as well and there were more carjackings in September 2025 post-deployment than there were pre-deployment in July 2025.
Carjackings in DC were down 30 percent or more compared to the same month the previous year in 17 of the 19 months through September 2025 including a 64 percent drop in July. This is part of a national trend of plunging carjackings. They fell most places in 2024 and they’re falling in most places in 2025.
Overall Violent Crime
The overall violent crime trend in DC has largely not changed from its previous path in my opinion. The questions about DC’s public data feed underreporting violent crime data persist without resolution, but comparing the public feed to the FBI’s new monthly data (available through July) shows pretty strong correlations between changes in the public feed (which we know is being underreported) and changes in the data to the FBI (which I feel pretty good about in terms of reliability).
Drops in the public feed should correspond decently closely with drops in the FBI reporting even if the public data is likely overstating the degree of the decline. By concentrating mainly on what’s happened since 2024 — after the observed change in reporting — and not just relying solely on MPD’s open data, we can evaluate the city’s current violent crime trend without worrying too much about the possibility of systemic underreporting in the District’s publicly available data.
We don’t yet have reliable CDE data covering August and September 2025 and won’t for a few months. Violent crime was down 32.8 and 39.6 percent in August and September 2025 respectively relative to August and September 2024 in DC’s open data, reflecting a continuing trend of falling violent crime in DC as seen in the more trustworthy reporting to the FBI.
The graph of violent crime rolling over 30 days shows the decline continuing through August before starting to reverse a small bit in September.
The general consistent decline in overall violent crime is more evident in the below graph showing the percent change in violent crime rolling over 30 days in DC relative to the same stretch the previous year. There is no dramatic change in the post-intervention, just more of the same decline in my opinion.
DC violent crime has been falling since peaking in 2023, and was down 35 percent in June 2025 compared to June 2024. So it’s hard to say with a ton of confidence what role, if any, the intervention had in the District’s overall violent crime trend we’re seeing.
Gun Crime
Whether gun crime (defined here as violent crimes with a gun as the weapon) fell after the intervention is a bit unclear but might have some supporting evidence. DC does not produce shooting data, but the Gun Violence Archive largely does and data from the GVA shows a drop in gun violence in DC starting around mid-August.
Shootings — which make up a small share of overall “gun crime” — definitely fell, and the below graph tracking shootings over 30 days certainly suggests an accelerated decline around the time of the intervention. But shootings have been falling in DC since peaking in mid-2023 and the exact impact of the intervention is a bit difficult to tease out in my opinion.
The 16 shooting victims in DC in September per the Gun Violence Archive were the fewest in a month since 2014 and the clearest sign of a possible positive outcome tied to the intervention.
Did the federal deployment have an impact on DC’s shooting trend? Maybe. I’d argue that it’s too soon to tell what the long term impact will be (if anything), but the pre-existing decline did seem to get steeper in mid-August. And a rough start to October so far is a reminder that these problems are by no means solved even in places seeing declining gun violence.
There are a few reasons to be hesitant about reading too much into the drop in shootings. As I noted, the deployment took place at a time when shootings have been dropping substantially in DC. Certainly the deployment of the National Guard can’t be credited for similarly large drops in DC shootings during the summers of 2022, 2023, and 2024.
Zooming way out to look at shooting victims in DC rolling over 12 months over the last decade is a pretty good showcase for why I think some tapping of the brakes is warranted. The last two months are barely a blip in what has been a strong downward trend for the last two years in DC gun violence.
You also have to consider that shootings were down nearly 20 percent nationally in September compared to September 2024 in the Gun Violence Archive data. Shootings are falling everywhere and were down nearly 40 percent in Chicago in September 2025 compared to September 2024 and right around 30 percent in Philadelphia and New York City in September.
Did the deployment cause DC gun violence to start falling? No. Did the deployment make the pre-existing drop bigger than it was before? Maybe, more time will provide a lot of clarity on that in my opinion.
But what about other gun-related violent crime? Honestly, it’s weird. Violent crimes with guns as the weapon fell right after the intervention started according to DC’s open data, but crimes with knifes and the vague weapon term “others” rose.
Combining the gun category with the other category shows no real change in violent crime after the intervention.
So what does it mean? Well, it could mean that people stopped carrying guns as often — which is backed up by the potentially accelerated drop in shootings — leading to fewer gun-related violent crimes. It could also mean that the police department started to use the ‘others’ category more often for reasons that are not clear from the available data. We have run into the limit of what DC’s publicly available data can say about the matter.
Ultimately, more time and data are needed to see whether there is any impact and, if so, how long it lasts.
Property Crime
There does seem to be stronger evidence of an impact on property crime. Property crime in DC was rising in the weeks leading up to the deployment and fell a fair distance in the six weeks after. This decline is by no means unprecedented — a similar drop occurred at this time of year in 2023, but it does show up on the below graph of property crime rolling over 30 days.
Much of the change in property crimes is due to a huge drop in vehicle burglaries and a smaller (though still sizable) drop in auto thefts. Burglaries and other thefts fell, but much more mutedly compared to the pre-deployment trajectories.
The drop in DC vehicle burglaries is neither enormous nor unprecedented, and it follows a generally pre-existing decline in these crimes over the last few years in DC. But vehicle burglaries and auto thefts — unlike violent crime — were rising in the weeks leading up to the deployment and fell a decent amount almost immediately. There are a few instances with similarly sized drops in vehicle burglaries — notably in August and September 2023 — so more time is needed to say whether this is a one-time blip or the the start of a larger trend.
Getting back to the general theme of it’s too early to say much with confidence, I wouldn’t confidently assert why I think this drop is happening. There is, however, some evidence of reduced mobility in DC as a potentially contributing factor to fewer property crimes.
The New York Times had a nice piece a few weeks ago measuring changing behavior patterns in DC. That piece used cell phone data to show people moving around less in the days following the deployment.
You can see similar trends of declining mobility possibly evident in both restaurant reservations as measured by OpenTable. There were 28 cities in OpenTable’s collection that had seated diners even or up in every month between January and August 2025. Washington, DC and Scottsdale, AZ (-2 percent) were the only two cities that had a drop in September 2025 relative to September 2024.
And a drop in riders among Capital Bikeshare members — who I’d guess are more likely to be residents — but not casual users (like tourists).
A drop in mobility is probably not entirely causing property crime to fall in DC, but it could have some responsibility. In much the same way (though far more severe) that COVID shutdowns helped dramatically reduce property crime, fewer people being out and about in DC could be helping to drive down property crime.
It’s also very possible that I’m reading too much into these datapoints. Other cities like Philadelphia and Miami Beach saw similar drops in OpenTable’s September data, and the more recent OpenTable data for DC has seen slight increases in early October. Additionally, a Capital Bikeshare price increase may be responsible for some of that drop — though the lack of a corresponding decline among non-members suggests that might not be the case. Finally, there’s no evidence of a change in metro ridership over the last few weeks.
I wouldn’t say anything confidently about the property crime trend other than that there appears to be a noticeable decline driven by falling reported vehicle burglaries. Ultimately, I’ll reiterate that more time is needed to tease out the actual impact of the deployment on DC crime.
In my opinion, there’s little evidence of a change in overall violent crime in DC, potentially evidence of the already downward trend in shootings accelerating, and reasonably strong evidence of a decline in certain property crimes that may or may not be tied to changing mobility patterns.
It’s not clear whether these trends will continue, abate, or reverse in the coming weeks. Ultimately, figuring out whether any changes are real, why these things are happening, and how long they might persist will take a good bit longer.
As always, a super thoughtful piece!
The secret of Trump's strategy is to launch a big performative move to take credit for trends established under Biden.