
Assessing DC's Violent Crime Trends
Murder is plunging in DC but what about overall violent crime?

To paraphrase Bart Simpson, Washington DC’s violent crime data and trends make it a land of many contrasts. As such, the theme of this post on DC’s violent crime trends is that multiple things are true.
DC’s publicly available crime data is mostly good with the city publishing some innovative datasets. DC has incident-level crime data available going back almost 15 years. They publish monthly staffing reports, a carjacking dashboard, clearances, arrests, ShotSpotter, and much more. But the agency's publicly available data may be overstating the degree that violent crime is declining right now.
Reviewing the agency’s data clearly shows the city’s trends:
Murder has consistently fallen since peaking in late 2023 and is tracking the city’s pre-COVID trend so far in 2025.
Carjackings in DC had an enormous surge in 2023 but have fallen consistently since then to levels consistent with the start of the pandemic (and are still falling). Yet carjackings are more frequent now than they were before COVID.
Measuring DC’s overall violent crime trend is a bit more complicated. Violent crime in DC is down a huge amount from where it was in the early 1990s and down a good bit from where it was a decade ago. Violent crime in DC fell in 2024 after increasing in 2023, that much is clear from DC’s reporting to the FBI. The exact picture for 2025 is a bit murkier though violent crime is likely falling this year. DC’s open data is likely overstating the degree of the city’s decline in violent crime right now though.
Let’s start with murder.
Washington DC recorded 482 murders in 1991 placing the city’s murder rate as the highest in the United States. That fell to an astoundingly low 88 murders in 2012 but has picked up in the last 10 years following trends seen in many US cities.
Murders in DC peaked in 2023, began falling in 2024, and have been steadily falling through July 2025. There were 96 murders through July 2025 in DC, down 11 percent relative to the same timeframe in 2024, down 34 percent relative to the first 7 months of 2023, and exactly the same number as was reported through July 2019. (UPDATE 8/18/2025: I initially used DC’s publicly reported homicide figure for 2024 in this graph to calculate a rate of 27.5, but I have updated it to use the FBI’s murder rate of 25.5 to make it apples-to-apples).
Next, carjackings.
DC has an excellent carjackings dashboard which clearly shows the city’s trends. Carjackings increased in 2020 and then nearly doubled in 2023 before peaking and firmly declining since the start of 2024. Carjackings are still reported more frequently now than they were before COVID, but there has been a consistent drop for more than 18 months. The 16 carjackings reported in DC in July 2025 were the fewest reported in a month since May 2020 — before the surge — and represented an 87 percent drop from July 2023’s total.
The available data suggests that carjackings tend to be disproportionately committed by juveniles. Less than 8 percent of Washington, DC arrests in 2024 were juveniles per MPDC data, but more than half of carjacking arrests involve a juvenile. So it’s also noteworthy the degree to which juvenile arrests for carjackings have fallen, at least through 2024 (2025 arrest data isn’t available yet).
Murder’s falling, carjacking’s falling, but what about DC’s overall violent crime trend?
The bottom line is that violent crime in DC is currently declining and the city’s reported violent crime rate is more or less as low now as it has been since the 1960s (Standard disclaimer that not all crimes are reported to police). The city’s official violent crime rate in 2024 was the second lowest that has been reported since 1966.
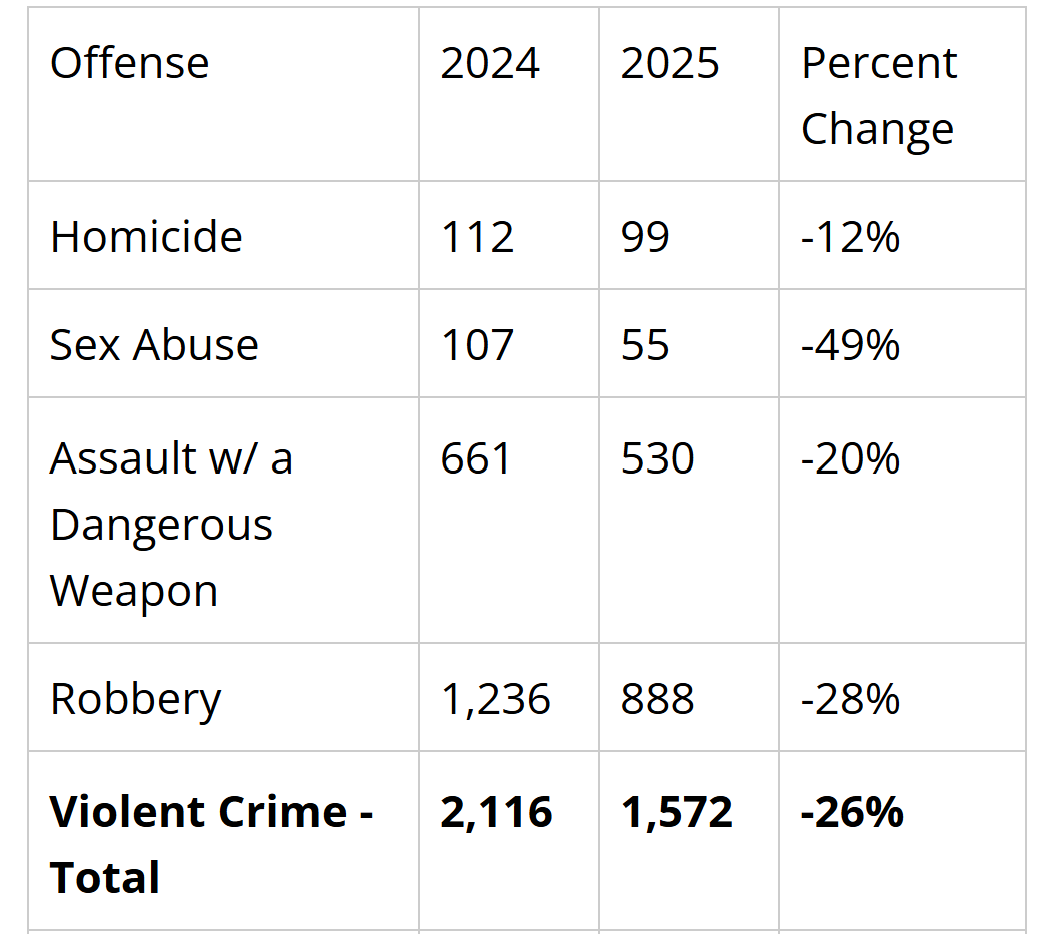
At the same time, the publicly available data from MPDC appears to be overstating the degree of the decline in 2025. If you go by DC’s publicly available data, you'll see that violent crime is down 26 percent as of early August compared to the same timeframe in 2024.
But, as Lee Corso might say, “not so fast, my friend.”
If you look closely, you might see something unexpected in the above table from MPDC’s website. The city publishes crime categories loosely based around Uniform Crime Report Part I offense types, but not exactly. As explained on DC’s website, “These numbers are based on DC Code Offense definitions and do NOT reflect Part I crime totals…”
So instead of publishing data on aggravated assaults, we get assaults with a deadly weapon. Instead of data on rapes, we get sex abuse offenses. That’s not inherently problematic, but comparing what is being published by DC to the numbers being reported to the FBI suggests that the department’s website is overstating the decline in violent crime over the last two years. Violent crime is still declining, but probably not as much as is being reported.
DC reported 1,026 aggravated assaults with a dangerous weapon in 2024 per MPDC’s website, but they reported 3,004 aggravated assaults to the FBI. The growing discrepancy between data reported to the FBI and the publicly available website can be seen in the below graph comparing aggravated assaults reported to the FBI to DC’s publicly available data rolling over 12 months.
DC reported a 7 percent increase in aggravated assaults in 2024 (which was offset in the violent crime count by large drops in robberies, rapes, and murder) but MPDC’s public data showed a 27 percent drop in assaults with a dangerous weapon. This contrasts sharply with 2020 when DC reported a 3.6 percent increase in assaults with a dangerous weapon compared to a 2.1 percent increase in aggravated assaults.
MPDC’s public data and the data reported to the FBI mostly agreed about 2023 (+39 percent increase in violent crime vs + 41 percent respectively). The data for 2024 (and most likely) 2025 is more problematic though given just how sharply the decline in MPDC’s public data differs from the decline reported by DC to the FBI via the Crime Data Explorer (CDE). Note that in the below chart that there’s no data from the FBI in 2021 and 2022 because of the NIBRS transition.
As you can see, it’s not unusual for MPDC’s publicly available data to suggest a larger drop in violent crime than is reported to the FBI (probably due to the former measuring incidents vs the latter measuring victims), but the percent changes are usually reasonably close. For 2024, however, the FBI’s data shows a 9 percent drop while MPDC’s public data shows a 35 percent drop.
We don’t have 2025 data from the FBI to know for sure that the department’s 26 percent decline from 2024 is an overstatement, but I’d be very surprised if it was accurate.
There’s still tons of evidence pointing to declining violent crime in DC in 2025, especially gun violence.
We trust the MPDC’s murder and carjacking figures which both show sizable declines in 2025 — especially compared to 2023. There is also separate data from ShotSpotter showing a 16 percent drop in alerts through the first half of 2025 compared to the first half of 2024 and a 45 percent drop relative to the first half of 2023.
I’m not sure why the discrepancy between MPDC’s public data and what’s being reported to the FBI has grown, but the enormous quantity and quality of open data provided by MPDC points strongly towards a data reporting issue rather than an intentional misrepresentation (though if you want to take the preceding paragraphs in bad faith and immediately jump to that conclusion, I guess that’s your prerogative.)
So while we don’t really confidently know exactly how much violent crime is falling in DC in 2025 from the public data, the drops in murder, and robbery this year — which conform much closer to what has been reported to the FBI — suggest violent crime is indeed dropping. Even if we can’t say for certain from the publicly available data how far it’s falling, there’s no reason to suspect the overall trend being reported isn’t correct.
One could rightly argue that 96 murders and 188 carjackings so far this year is still far too many heinous tragedies. But one must be able to differentiate between a crime’s level leaving room for improvement while also acknowledging a strong downward trends in the crimes with the highest cost to society in the nation’s capital.
From NBC News in Washington July 18, 2025:
The union claims police supervisors in the department manipulate crime data to make it appear violent crime has fallen considerably compared to last year.
“When our members respond to the scene of a felony offense where there is a victim reporting that a felony occurred, inevitably there will be a lieutenant or a captain that will show up on that scene and direct those members to take a report for a lesser offense,” Fraternal Order of Police Chairman Gregg Pemberton said. “So, instead of taking a report for a shooting or a stabbing or a carjacking, they will order that officer to take a report for a theft or an injured person to the hospital or a felony assault, which is not the same type of classification.”
The union has been gathering evidence for some time now by looking at reports and talking with officers all over the city, Pemberton said.
Found my way here through the interview with Paul Krugman, and happy to subscribe. In another post, Krugman, noting that the relationship of economic data is far from exact, says, “this is economics not physics.” So too crime data.
Jeff notes that DC tracks serious assaults differently that the FBI defines aggravated assault for UCR. Across river in Virginia, there are degrees of assault, including what generally would be deemed a hate crime that may not meet the UCR definition. With the best of faith, there’s always going to be some sanding and planing in moving information from the 18,000 U.S. law enforcement agencies, mostly local, through the State to the FBI. Arriving in a final fashion to citizens about two years later.
The National Incident Based Reporting System (NIBRS) is intended to improve on UCR, particularly in timeliness, but it’s worth emphasizing that 75% of those agencies have less than 50 officers and the IT infrastructure to fully implement NIBRS has been a fiscal struggle (in GA where I live for example).
Agencies use more real time data, many in variations of NYPD’s CompStat, and many put that up for citizen to view which creates opportunities for what I believe Jeff is about. A citizens’ CompStat as a balance to the common misperceptions about crime in the United States.