
When Crime Gets Exceptionally Cleared

Crime statistics can be confusing and difficult to effectively communicate, and no statistic embodies this as much as clearance rates. Logically, clearance rates are a measure of productivity which in theory represents the share of crimes solved by an agency in a given year. But logic has no place when it comes to calculating clearance rates in reality.
Clearance rates are made up of a denominator encompassing all the crimes that occurred in a given year and a numerator encompassing the number of crimes cleared in that year regardless of when they occurred.
Let’s say a city has a double murder on December 31st and another murder on January 1st. If they solve the double murder on January 2nd then they have a 200 percent murder clearance rate for the year despite having not solved any of that year's murders.
It gets more confusing from here because clearances are made up of offenses that are cleared by arrest and offenses that are cleared by exception. The former concept is relatively straightforward, but the latter is a bit more complex and boils down to offenses where an agency knows who did a crime but cannot physically arrest them for a variety of reasons. The full definition is screenshotted below:
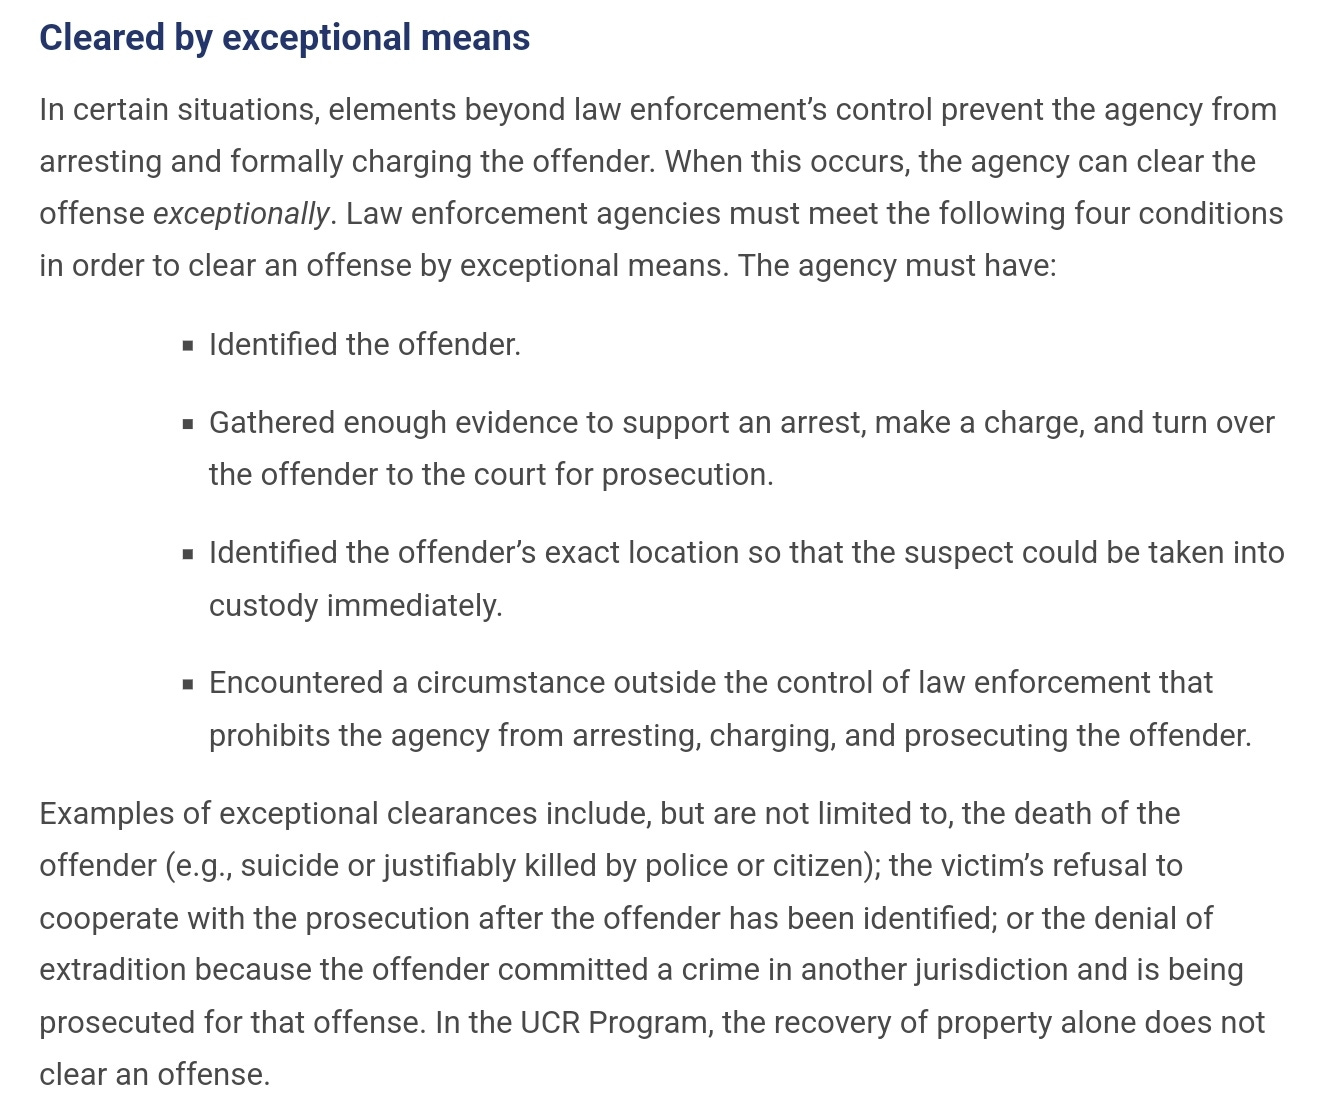
A freqient question stemming from this complexity is just how often are cases cleared by arrest versus exception? It hasn't been an easy question to answer because the FBI has traditionally only reported clearances without a breakdown by type. State UCR programs publishing NIBRS data makes the whole thing much easier though.
I was able to grab clearance type data for 14 states that publish with sufficient detail — though note that not every state had data for the same year. For this analysis I only looked at murder, rape, and motor vehicle theft as three offense types that I thought would be sufficiently different and interesting.
The murder clearance rate in these states was around 60 percent, rape was around 23 percent, and motor vehicle theft was under 10 percent. Exceptional clearances were most prevalent in rapes while they were virtually non-existent in car thefts.
Breaking down exceptional clearances by state shows a fairly wide difference in how certain states handle exceptional clearances.
Nearly half of all rape clearances in Colorado, South Carolina, Tennessee, and Virginia, for example, were cleared by exception while other states like Arizona, Nevada, and Massachusetts used exceptions far more rarely. A high share of motor vehicle thefts being cleared by exception in states like South Carolina and Nebraska reflects the fact that only a tiny portion of all such offenses were cleared at all.
This analysis is only possible because NIBRS requires agencies to provide a justification for exceptional clearances and NIBRS-compliant states are doing a better job of publishing their data. There are five justifications that an agency can use to describe why an offense was cleared by exception:
Death of offender — an instance where the offender is known but deceased — such as in a murder-suicide.
Prosecution declined — an instance where a prosecutor declines to prosecute for reasons other than a lack of probable cause.
In custody elsewhere - an instance where the offender is known and could be arrested but is incarcerated elsewhere.
No custody because of a juvenile status - an instance where the perpetrator is a known juvenile who could be taken into custody but is not (i.e. being given a warning after a minor offense).
Victim refused to cooperate - an instance where the offender is known but cannot be arrested because the victim will not cooperate with law enforcement.
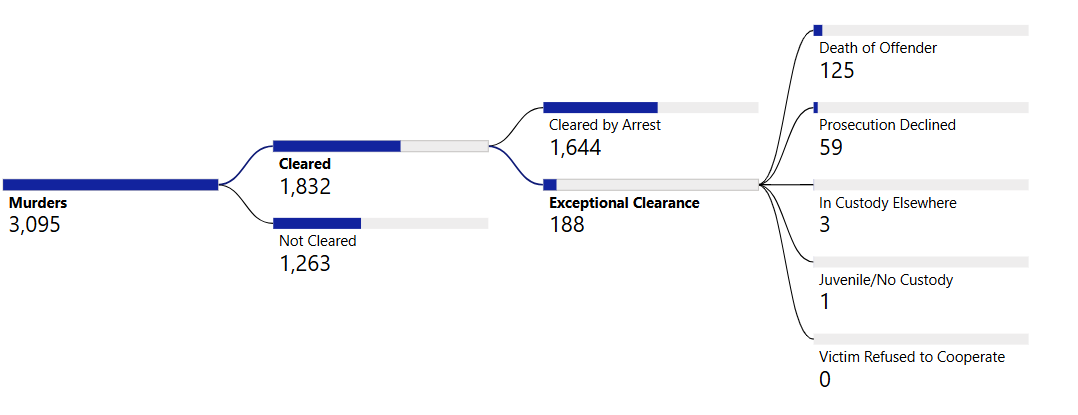
I created the below flow charts to show how a murder, rape, or motor vehicle theft offense moves through the clearance process. Note that the total number of crimes differs slightly from the above table because it isn’t possible to break down 2024 exceptional clearances in Minnesota by type of exception.
Murder
Rape

Motor Vehicle Theft

Finally, we can break down exceptional clearances by state and type of exceptional clearances. For murders, the death of the offender accounted for around two-thirds of exceptional clearance with prosecution declined making up nearly all of the rest. Unsurprisingly, lack of victim cooperation didn’t result in any murder exceptional clearances.
Rape cases, by contrast, are cleared by exception due to declined prosecution or lack of cooperation far more often than the other categories.
And motor vehicle theft exceptional clearances are a bit more varied with a fair share being clearances because the offender was in custody elsewhere.
Clearance rates are problematic because they are easy to manipulate and can show an agency with a low arrest rate clearing cases at a high rate. Still, they’re the best metric we have for evaluating an agency’s performance in solving the offenses that occur in their jurisdiction. Understanding how exceptional cases factor in is a critical component for better contextualizing clearance rates and hopefully this piece has helped shine a light on the matter.
Thank you for diving into this topic! There continues to be inconsistency and confusion among/across law enforcement agencies when it comes to exceptional clearance for sexual assault cases. The folks at BJA did a deep dive on this with 2019 NIBRS data, and it showed that some states are clearing up to about 40% of their rape cases exceptionally, which guarantees that they are (a) doing it wrong and/or (b) disproportionately rejecting viable cases for prosecution. I can't find the online report now; it may have been removed.
Some agencies misunderstand the victim non-cooperation aspect, and clear cases as exceptional any time the victim doesn't return their calls (but before an actual investigation was completed). EVAWI offers an excellent source of expertise and perspective on this topic; this link is for a training course, but you can also just download the training module as a PDF. https://evawintl.org/courses/evawi-10-clearance-methods-for-sexual-assault-cases-2/
"Clearance rates are made up of a denominator encompassing all the crimes that occurred in a given year and a numerator encompassing the number of crimes cleared in that year regardless of when they occurred."
While the above clearance calculation method definitely works best for homicides, which often have long timelines in terms of clearances, for most other crimes the "best" numerator would be the cleared subset of crimes that occurred in the year of occurrence. Further, even for homicides, I'd argue for this approach once the agency is reporting about anything except the current year.
Because frankly, using EVERY cleared crime as the numerator is just law enforcement putting its best spin on the data, because the clearance rate for the current year has nowhere to go but UP using this method, while clearance rates for prior years would (or at least, SHOULD) be forever frozen. But, I suspect that some law enforcement agencies basically double-count these old clearances, so a 2023 murder cleared in 2025 would raise the clearance rate for 2025 AND show as a cleared murder in 2023 historical crime data.
Personally, I would recommend that large law enforcement agencies publish BOTH clearance rates for homicides, along with an explanation of the difference.