
When 100% Doesn't Mean 100%
How often is a case cleared in the year it occurred?

Brief interruption of your regularly scheduled post to announce the launch of Aggregated, a YouTube channel from the Real-Time Crime Index. The goal of the channel is to better communicate crime data to the small minority of people who don’t read this Substack. The first video is up so be sure to head over there after reading this to watch and subscribe! Now, onto the post.
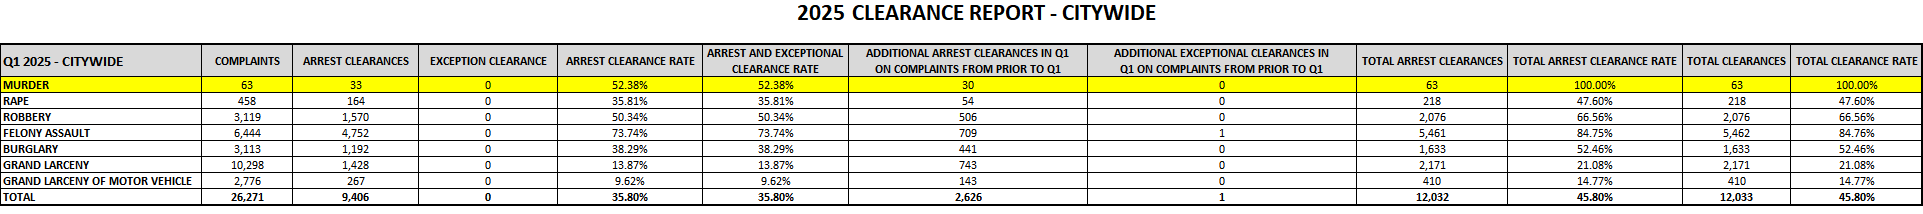
What if I told you that NYPD reported a 100 percent murder clearance rate for the first quarter of 2025. You’d think that meant they made an arrest (or otherwise cleared) every murder that occurred between January and March 2025, right?
Well, you’d be wrong.
More on that in a minute.
Clearance rates are a weird statistic. They’re the standard metric for evaluating law enforcement effectiveness, but they also make only slightly more than zero sense.
Let’s math a little to see why.
The clearance rate denominator is simple enough, it’s the number of offenses counted by an agency to have occurred in a given year.
The numerator is more complicated. An agency will count the number of offenses cleared by arrest or exception (head here for a full description of what those terms mean) in a given year regardless of when the offense took place.
So let’s say there is a double murder in a city on December 31st, 2024 and a single murder on January 1st, 2025. If the double murder is solved on January 2nd then the agency would have a 200 percent clearance rate in 2025 despite not having solved any of that year’s murders.
Clearance rates are decent enough as the agreed-upon metric for measuring law enforcement performance, but they also can create very strange results. My personal favorite is Costa Mesa, California reporting 2 murders and 34 murder clearances in 2020, good for a 1,700 percent murder clearance rate. Ideally, clearance rates would either change each time new data is reported or would clearly delineate when cleared crimes occurred.
That they do not raises the obvious question: what share of a given year’s clearances come from previous years?
There are a handful of agencies that report such information, but most do not.
The good news is that NIBRS allows one to compare an offense’s arrest date with its incident date and see how many offenses that were cleared by arrest in one year occurred in a past year. For the purpose of this analysis, an offense is considered cleared by arrest if that offense has an arrest date associated with it.
The bad news is that working with NIBRS is challenging and undoubtedly prone to inexactitude. It may not match exactly what is reported by agencies but it should be close (translation: I tried my best).
I was able to breakdown murder clearances for 18 cities using public reporting from Kansas City and New York City and State UCR open data from the other cities.
This graph shows a couple of things. New York City reported that 100 percent clearance rate on 63 murders in the first quarter of 2025. But when you break down the clearances down using NYPD’s extremely helpful report you’ll see that only 33 of the clearances come from murders committed in Q1. The first quarter having a relatively high degree of clearances come from a past year makes sense, but it also provides the perfect backdrop for understanding why a 100 percent clearance rate does not mean every crime was solved.
Overall, right around 20 percent of clearances that were reported in this sample of agencies came from cases that occurred in previous years. You could argue that these clearances even out, 2024 arrests count towards 2025’s clearance rate just as 2025 arrests will count to 2026’s clearance rate, and there’s some truth to that.
But it’s not clear obvious just how consistent past year clearances are from year to year, and it makes an agency’s current year clearance rate even more responsive to previous year spikes and troughs providing more cases to solve.
In my opinion, the main problem with relying on past years to calculate current year rates is that it muddies the water towards answering a relatively straightforward question: how many crimes had an arrest (or were cleared by other exceptional means) in a given year?
Just because a police department's reported clearance rate includes old cases doesn't mean they're manipulating stats. Clearances have been the agreed upon metric for evaluating how departments are doing solving crime for decades.
Still, hopefully breaking down clearances by when the offenses occurred provides some critical context into understanding why a department saying they're at an 80 percent clearance rate doesn’t mean they're making an arrest in 4 out of 5 cases.
This is a great post and I'll do my part to share it far and wide. Unfortunately, it's not the "sexy" side of policing, and it does not get much attention. Even worse, when it does, it is usually by members of the media who have no idea what they are looking at—and I don't blame them, because most cops don't understand it either. So it gets misused and abused.
For years, I've wondered if we will ever be able to reform this system. With modern CAD/RMS systems that integrate with court systems, we should be able to follow every single arrest case from initiation to final disposition. This would allow us to get a picture of the effectiveness of the Criminal Justice system as a whole, because "cleared by arrest" does not mean "conviction."
Thanks for this article and for exposing the weirdness about clearance rates.