Murder Clearance Rates Probably Rose in 2023
Using state data to read the clearance rate tea leaves.
Clearance rates were low nationally in 2022. Historically so.
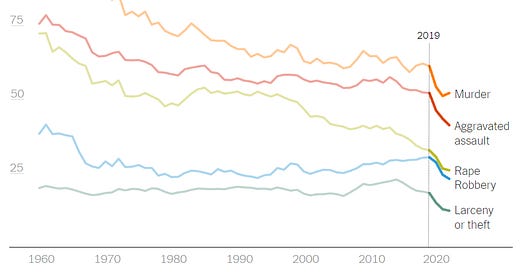
I wrote an op-ed in The New York Times last December about how clearance rates as reported by the FBI were the lowest ever reported pretty much across the board with a sharp decline being evident post-COVID.
Here’s the graph of clearance rates since the 1960s though clearance rates were likely artificially high in the 1960s and 1970s.
The murder clearance rate in 2022 was lower than any year other than 2021, and the 2021 calculation is fraught with uncertainty due to the NIBRS switch. Which brings us to 2023.
The full numbers for 2023’s clearance rates won’t be released until October, but I’ve started grabbing data on 2023 from states that have already published it and murder clearance rates are still below where they were 15 years ago, but they appear to have roughly returned to (or slightly below) 2019 levels in 2023.
I found 23 state UCR programs that have published data on murder clearance rates for both 2022 and 2023. Agencies have to have submitted their data by now to have it included in the 2023 official figures as reported by the FBI, so the sample should be more or less complete. All told, murder clearance rates were 4 percent higher in 2023 than in this same sample of states in 2022.
Murder clearance rates dipped in the sample (and nationally) in 2020 and 2021 though, again, the latter year’s decline is somewhat uncertain due to the NIBRS transition. Clearance rates rose relative to 2021 in 2022 though they were still very low by historical standards. In 2023, however, murder clearance rates in the sample had nearly returned to 2019 levels in this sample.
The sample does not perfectly predict the national murder clearance rate, but it does portend a good sized increase occurred in 2023. Murder clearance rates in the 23 state sample have been higher than the national estimated murder clearance rate in each of the last 16 years by an average of 3.2 percent.
Still, a sizable increase in the national murder clearance rate from 2022 to 2023 appears to be in store which should bring it roughly in line with (even if it’s still below) where things stood in 2019 and well above where they were from 2020 to 2022. This 23 state sample has tended to predict the national murder clearance rate change pretty well over the last 20+ years as shown on the below scatter plot showing the year to year change in the murder clearance rate nationally (Y-axis) versus the change in this sample (X-axis).
So murder clearance rates rose across the 23 states with publicly available data so far, and these 23 states tend to be good predictors of the national clearance rate trend. It's certainly possible that the FBI's formal data won't match what is found in the sample, but that would buck historical patterns.


You never explained what is exactly meant by “clearance rate”. Thanks.
An eyeball of the data in the table showed the drastically different murder numbers by state vs the clearance rate doesn't necessarily correlate that low numbers leads to higher clearance. Of course resources are not equivalent between states to tackle the crimes so maybe that isn't unusual. I know from my state that we often hear in the news from law enforcement that number of murders is compared to the previous year and their goal is to not exceed that in the current year if possible. Seems kind of a backwards way of measuring to me. :)