Examining The Role Of Randomness in Murder
There is a common retort I hear pretty much any time I suggest that murder is falling: it’s only because medical techniques have improved. This may be true when comparing gun violence from 2023 with gun violence from the 1990s or early 2000s, but I struggle to find any evidence of improved medical care substantially changing a city’s murder rate from one year to the next.
Oftentimes, however, one of the biggest factors influencing the change in murder at a local level from one year to the next is luck or randomness. To be clear, murder is falling in 2023 because fewer people have been shot this year relative to the last three years at this time. But even this year there are clearly places where murder is up in spite of falling gun violence or murder is falling faster than shootings are falling, and I tend to think of those changes as largely driven by luck or randomness. There is a lot of randomness in play when a bullet leaves the gun that determines whether a person is hit and how severely they are wounded.
There are two main observations I think are important relative to the role of luck or randomness in understanding changing murder trends.
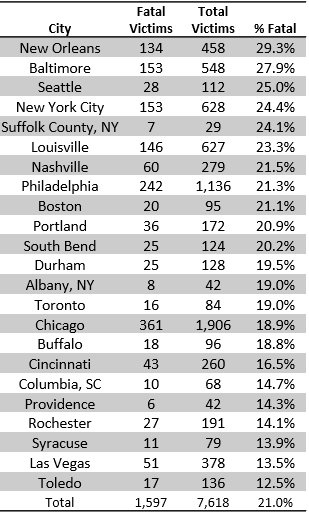
The first observation is that roughly 1 in 5 shooting victims — defined here as an individual shot with a gun by another individual — die in the cities with available data. Below is a table of 23 agencies with available shooting data, mostly for 2023. There is some variation between cities, but most cities I’ve observed tend to hover around or below that 20 percent figure.
Some data notes: the data is from 2022 for South Bend and Providence, January to October 2021 for Louisville, the first six months of 2023 for New York City, and Toronto is a small town in neighboring Canada for those Americans who may not be aware.
Firearms account for the vast majority of murders in nearly all of these cities. A firearm was used in 2020 — the last year with reliable data — in around 90 percent of murders in New Orleans, Baltimore Nashville Toledo, Durham, Cincinnati, and many other the cities on the above list.
Understanding the role of randomness in gun violence trends, therefore, is critical. Murder is up YTD but shootings are down in four of the 22 cities on the above table (Seattle, Boston, Portland, and Durham) suggesting that luck is potentially the determining factor in a crime trend that will almost certainly be attributed to other factors. There have been 6 more murders so far this year in Durham, for example, relative to YTD 2022 despite 16 fewer people being shot over that span.
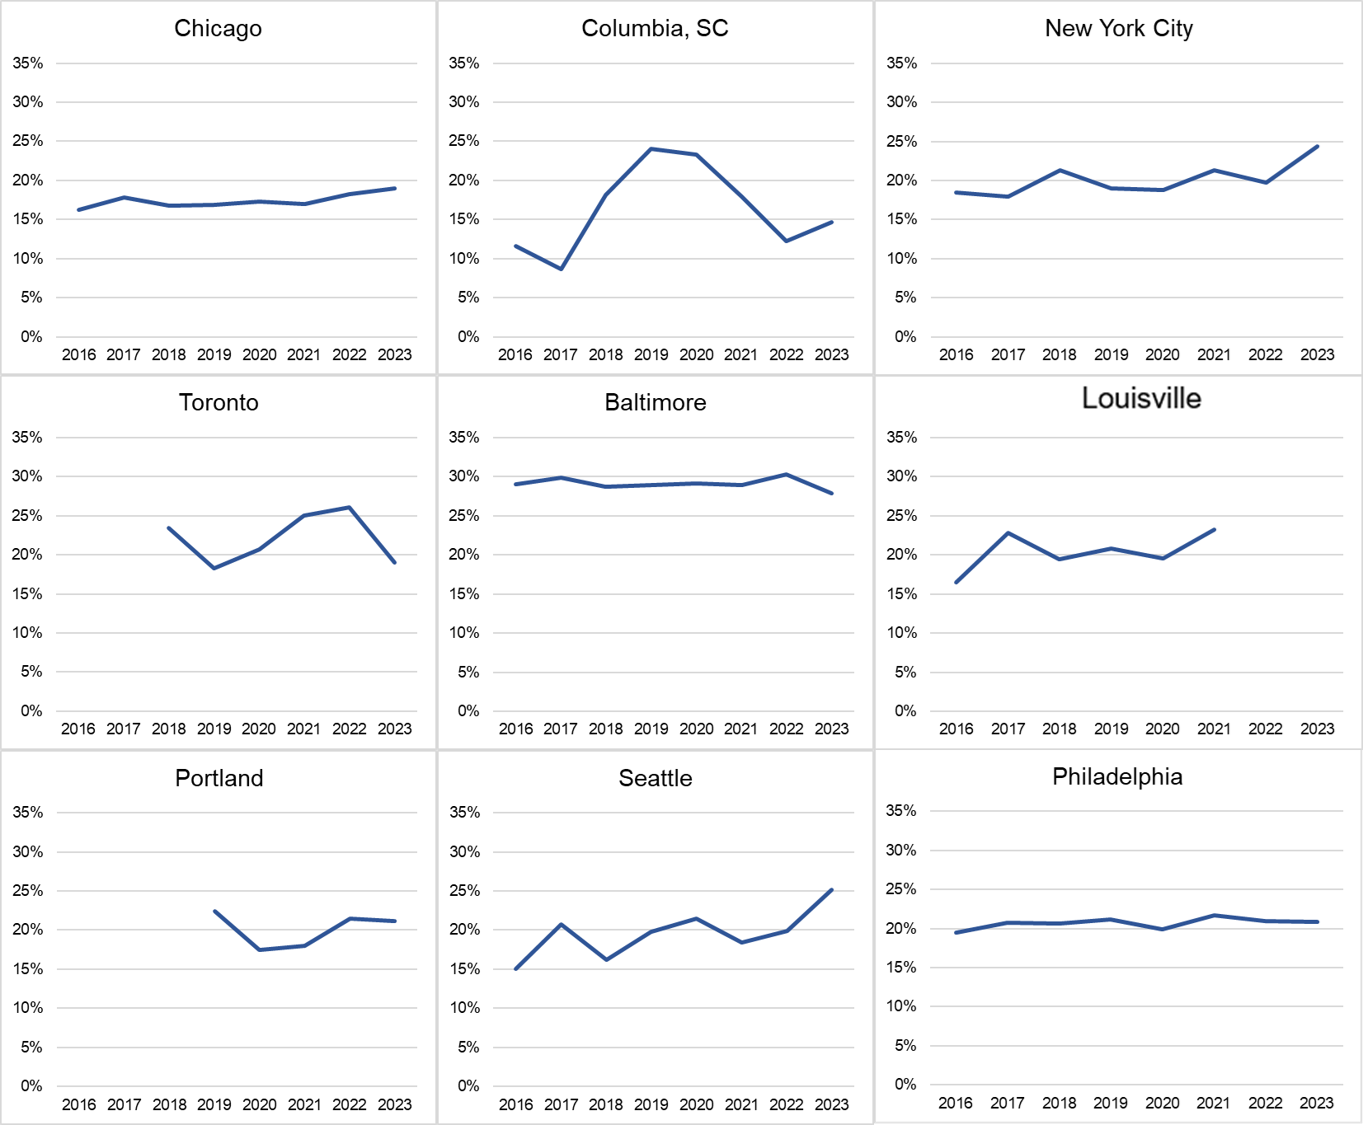
The second observation is that the share of shootings that are fatal appears to vary between cities, but it tends to stay relatively stable within each city from year to year. Consider the below graph of the share of shooting victims who died per year in 9 cities with data for all or most years between 2016 and 2023. Chicago, Philadelphia and Baltimore are nearly straight lines while cities with a lower volume of shooting victims each year such as Columbia, South Carolina and Toronto, Canada jump around a bit more. As an aside, one thing that jumps out is that there is no clear steady downward trend in any city like one would expect if emergency medical techniques employed over the last few years was saving more lives in 2023 than in 2016.

New York City this year is an interesting case study where the share of victims who died in the first half of 2023 is higher than normal. Typically when that happens over 6 months in New York City there tends to be a reversion to the mean over the following 6 months. Consider the below scatter plot with the share of shooting victims who died in each half of a year from 2010 to 2023 along the X-axis and how that percentage changed over the half year that followed along the Y-axis.
The same is true in Baltimore where nearly 30 percent of shooting victims have died on average since 2016, but that percentage has been under 28 percent so far in 2023. Some reversion back to the mean should be expected over the rest of the year in both cities.
When the share of shooting victims who die changes from one year to the next it is typically cited as evidence of city government doing something right or wrong, but one should not discount the impact of luck or randomness.
Almost a decade ago I emailed Voros McCraken, a baseball sabermetrician whose discoveries changed the game of baseball. I asked McCraken for advice in helping to explain the role of luck or randomness to audiences that might be skeptical of their role in murder trends. His reply has stuck with me.
McCraken generously wrote back, in part saying:
“Unfortunately you have stumbled on one of life's truisms when it comes not just studying BABIP or baseball or crime or whatever, but any time probability is involved: human beings, as a rule, do not like to ponder the extent to which luck (or random chance or whatever) affects outcomes in the world around them, and I'm guessing they particularly don't like to ponder it when it comes to things like life and death.
As for tips in dealing with this normal reaction, here's one that I have absolutely no guarantee will work: one of the keys to explaining probability and chance to a skeptical audience is to emphasize the vast amount of factors that could affect the outcomes you're studying and that while you can control for some of these, most are so hidden or hard to know, their effects on the outcome seem random. Random chance and 'luck' isn't about things which have a random number generator affecting them, it's about our own lack of knowledge on the factors determining the outcome. When we don't know and at least temporarily can't know about those factors, we use random numbers and probability as a way to still be able to move forward to find out whatever information we can.”
Why do a higher share of shooting victims in Baltimore and New Orleans die than anywhere else with available data? There are any number of possible explanations — some of which I can articulate, others which may or may not be knowable and are therefore deemed “random”.
Both cities have world-class trauma centers, so it’s not likely that sub-standard trauma care is the answer. Perhaps it has to do with emergency medicine deployment techniques, or the distribution of deadlier firearms in those cities than other places, or better street lighting, or more vicious shooters that take head shots more often, or a higher share of shootings use rifles, or any number of factors that aren’t as obvious.
One challenge to answering these questions is that we don’t have great shooting data nationally. It is novel just to have nearly two dozen cities publishing shooting figures like this. Few cities have more than a few years of publicly available shooting data and there is no national standardized collection of gun violence data.
Additionally, the type of data that is collected isn’t inherently detailed enough to answer the questions we want to answer. I want an estimate of the distance from shooter to victim for as many shootings as possible, the number of casings recovered at each shooting, the part of body each victim was shot in, how much street lighting there was, the length of time it took for the ambulance to arrive, whether a victim died on the scene, in the ambulance, or at the hospital.
Some of these are knowable though it’s not even clear that having some of these datapoints would help to answer the most pressing questions.
The question of why shootings are deadlier in some cities than others is not merely academic, for if one could figure out why this trend persists then one could plausibly figure out a way to disrupt it. Until then, we must continue to do better at measuring the trends and accept the role of random factors that we cannot know or control.


Fatality rates for shootings in general have actually been *increasing* over time, https://jamanetwork.com/journals/jamanetworkopen/article-abstract/2788467. The likely reason is semi-automatic and larger caliber firearms becoming more common in shootings.
Rambling a bit...
The rule of thumb that a change in counts of independent events from N1 to N2 is probably more than random noise if |N1-N2| > sqrt(N1 + N2) is still pretty useful, and I think it's hard to get much more information by checking if shootings and fatal shootings moved in the same direction. (In the case of crimes, of course, you should also adjust N1 and N2 for population change, because more people is a real but boring reason for more total crimes.) We know the rule is imperfect beyond just being only true on average -- it's not 50 independent events if fifty migrants die of heat stroke in a semi trailer in San Antonio or a very well armed nutter cuts loose at a concert. The reason the deaths happened that year instead of a year later or earlier could be all but random from a policy standpoint.
In contrast to murder fluctuations in cities that might have 20 murders a year, it's a big country, and any change in murder rates nationally over ~2% is not "just random." Something happened, now you can argue over what that was and whether it represents anything lasting and worth worrying about.
The distinction between "sustained trend" and "sustained difference" is also important. The murder rate increase since 2014 has been a sustained difference, that didn't and I believe still won't go away in just a few years. There is much less basis nationally to claim a sustained upward trend.
I don't know whether major harm to a city's reputation typically constitutes a sustained crime trend or only a sustained crime difference. There are chronic negatives, such as the many year accumulation of effects from reduced preference of businesses and residents to locate there, and acute negatives like riots. A worse city reputation supports a sustained increase in crime rates, but support for a sustained upwards trend is mixed.