Another Cautionary Crime Data Tale
If crime data looks absurd there's a good chance it's wrong.
Crime data can be difficult to analyze in even the best of situations, so it is important to be cautious when using crime data to ensure that what your analysis says matches the data. If that opener sounds familiar it’s because I took it word for word from a post I wrote a few weeks ago.
That post analyzed a thoughtful piece that I thought did a poor job of contextualizing a piece of crime data. This post discusses a report about crime data that is quite the opposite.
Compare.com published this report in late 2021 though it was just brought to my attention recently. Yes, it’s old, but the mistakes are so glaring that I thought it would be worthwhile to highlight just how much people need to be skeptical of reports like this. Especially when they're coming from random publications that don't adequately explain their methodology and data access.
Let’s dig in!
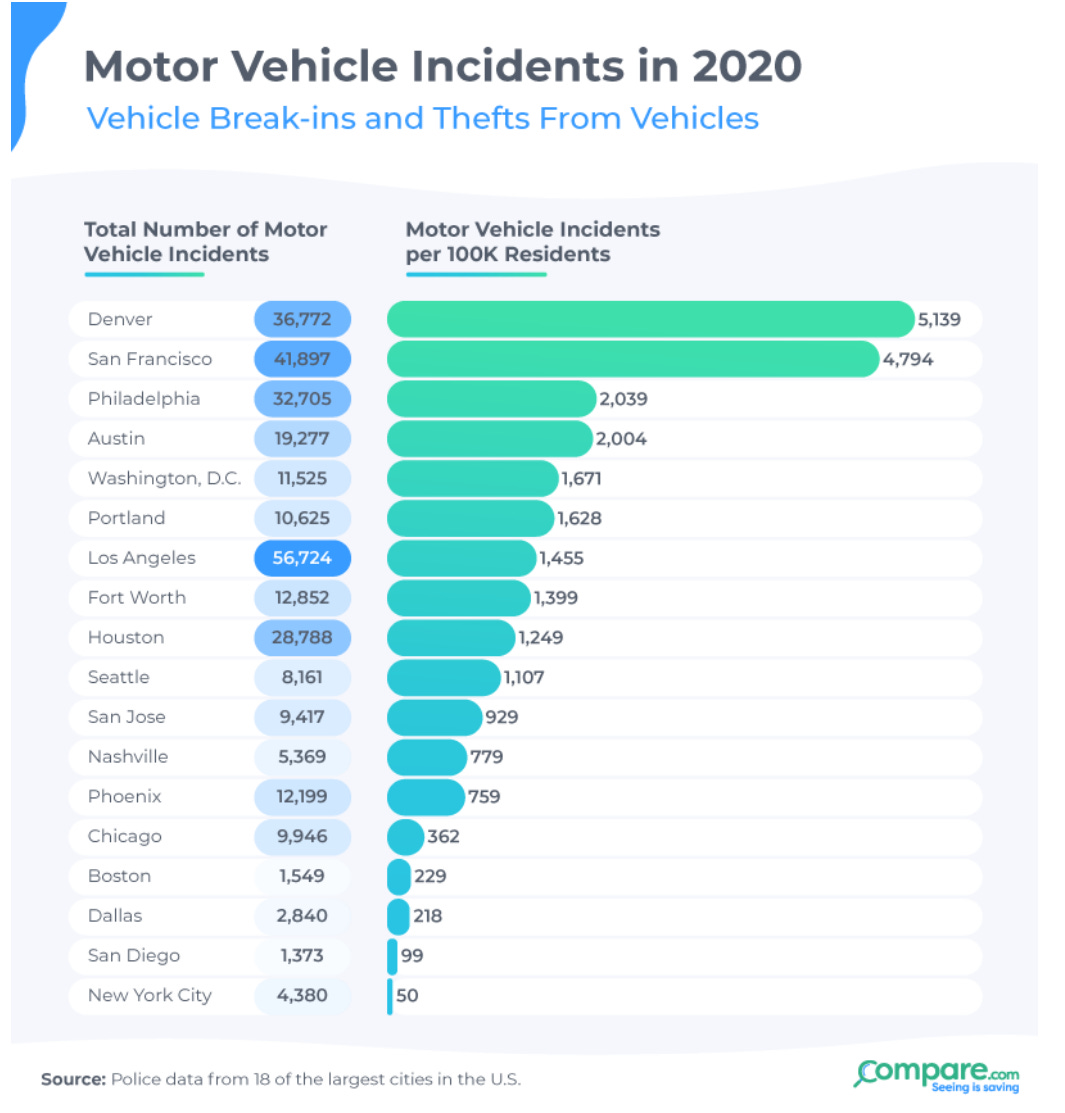
The methodology used in the analysis is reasonably clear: “For 18 of the 25 largest cities in the U.S. where police data was readily accessible, we looked at the total number of motor vehicle incidents reported, as well as the number of incidents per 100,000 residents. These numbers include all incidents involving a vehicle, from auto theft to attempted theft and vehicle break-ins.“
We’re off to a good start! The description of the methodology seems ok and they’re using data from police departments which I usually like. Wait, actually, we’re not. I have a few issues with this methodology.
First and foremost, what does “police data” mean? Is that incident data? 911 Calls for Service data? Vibes data? There is an enormous difference between using Calls for Service in some cities and using actually reported crimes in another. You can’t just call both “Police Data” and go about your analysis. Police data is nuanced, so too should be the description of said data.
In addition, auto thefts are reported to police at a substantially higher rate than vehicle burglaries. The National Crime Victimization Survey from 2020 reported that 75 percent of auto thefts were reported to the police compared to 44 percent of burglaries — not specifically vehicle burglaries. So combining the two into one overarching crime category is a bit problematic.
Then there is “Vehicle Break-ins and Thefts From Vehicles” in the graphs subtitle. Oh man, the good start is officially over didn'tnot include auto thefts.
The last major methodological problem I have is that auto theft is an official Uniform Crime Report Part I category while vehicle burglary is not. Vehicle burglary IS a NIBRS category, but around half of the cities included in this analysis were/are not NIBRS compliant. So you can get formal crime stats on both auto theft and vehicle burglary from the NIBRS-compliant agencies but you have to improvise from various sources if you want comparable data from many of the non-NIBRS agencies.
The Compare.com analysis looked at 18 cities and I tried to replicate them all. The results were…not great in almost all of them. To be clear, the data that was available in October 2021 is not the same that is available today, but it shouldn’t vary by all that much.
I’ve categorized the 18 cities by how easily I was able to pull their data.
Really Easy
There were nine cities that had easily accessible public data that allowed for a comparison between the public data and the data Compare.com reported. Of those, one city was nearly exactly correct and two cities were somewhat close to the number reported by the police department. Calling 2,500 crimes “somewhat close” is generous, but I’ll be generous in the spirit of setting a good example for my kids. The remaining six cities were waaaaaay off what Compare.com reported.
Washington, DC:
Compare.com: 11,525.
Official Source: 11,799.
Difference: Compare -274.
Fort Worth, TX
Compare.com: 12,852.
Official Source: 10,823.
Difference: Compare +2,029.
Austin, TX
Compare.com: 19,277.
Official Source: 17,098.
Difference: Compare +2,179.
Portland, OR
Compare.com: 10,625.
Official Source: 18,320.
Difference: Compare -7,695.
Seattle, WA
Compare.com: 8,161.
Official Source: 17,241.
Difference: Compare -9,080.
Philadelphia, PA
Compare.com: 32,705.
Official Source: 22,026.
Difference: Compare +10,679.
Denver, CO
Compare.com: 36,772.
Official Source: 19,099.
Difference: Compare +17,673.
San Francisco, CA
Compare.com: 41,897.
Official Source: 20,627.
Difference: Compare +21,270.
Houston, TX
Compare.com: 28,788.
Official Source: 50,235.
Difference: Compare -21,447.
A Bit Tricky
There were five cities that had available data but it wasn’t particularly easy to access. None of the figures reported from Compare.com came close to matching what was officially reported in these cities, and the numbers cited for Dallas and New York City were laughably wrong.
Boston, MA
Compare.com: 1,549.
Official Source: 4,674.
Difference: Compare -3,125.
Nashville, TN
Compare.com: 5,369
Official Source: 13,620 (through December 26, 2020).
Difference: Compare Compare -8,251.
Los Angeles, CA
Compare.com: 56,274.
Official Source: 47,349 (through December 26, 2020).
Difference: Compare +9,375.
Dallas, TX
Compare.com: 2,840.
Official Source: 26,359.
Difference: Compare -23,519.
New York City, NY
Compare.com: 4,380.
Official Source: 28,813.
Difference: Compare -24,433.
Not Great, Bob
There were 4 cities — all non-NIBRS agencies — that I was unable to replicate in any way. Perhaps there was data available in 2021 that is no longer available, but I tend to doubt it. It’s wholly unclear where Compare.com got their figures.
Chicago
Compare.com: 9,946.
Official Source: None exists. The city’s open data does not specify vehicle burglaries in any manner as far as I could tell. CPD reported 10,053 auto thefts alone to the FBI in 2020 so this figure is clearly wrong.
Phoenix
Compare.com: 12,199.
Official Source: None exists. The city publishes aggregated statistics and incident-level data, but neither dataset breaks down vehicle burglaries as a specific crime.
San Diego
Compare.com: 1,373.
Official Source: None exists though I suspect that they used San Diego’s publicly available Calls for Service data. It’s not clear where they came up with this figure though. San Diego reported 4,953 auto thefts alone to the FBI in 2020 so this figure is clearly wrong.
San Jose
Compare.com: 9,417.
Official Source: None exists though I suspect that they used San Jose’s publicly available Calls for Service data. San Jose does have publicly available crime data but it does not differentiate between types of burglaries.
The Final Word
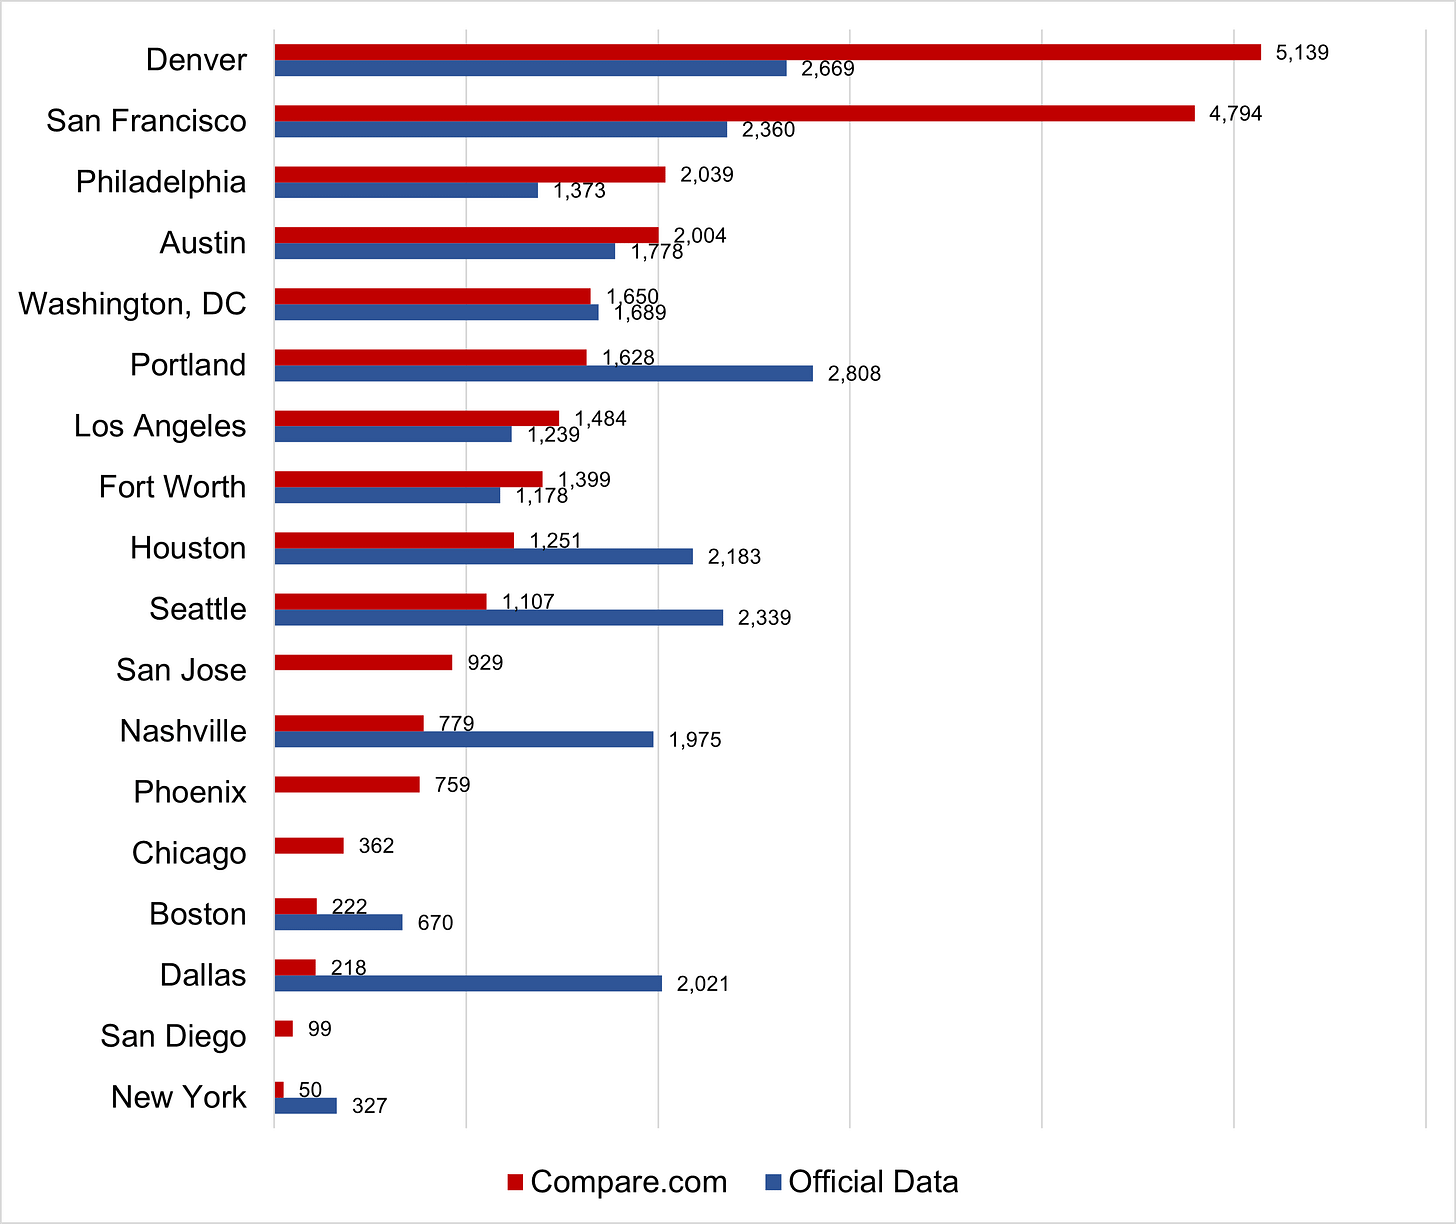
Putting every city together you get the below graph with Compare.com’s published rate in red and the rate from the official data as best I could grab it in blue. Quite a difference!
The lesson here is that readers should be extraordinarily cautious when evaluating “analysis” from 3rd party sources like Compare.com and NeighborhoodScout. And if somebody is analyzing crime data and the results don’t make any sense then there’s a good chance they’re wrong.


Awesome piece, Jeff. I'd read an entire book of these.
So was all that stuff we read in the times picayune this week about lower crime here a bunch of crap?