
Announcing The Crime Index!
A crime data Festivus for the rest of us!

We launched the Real-Time Crime Index in September 2024 with the goal of acquiring crime data from around 500 agencies nationwide to create a mechanism for measuring changing crime trends nationally as they occur.
That project has succeeded with our most recent update covering more than 560 agencies nationwide. The result is that we know the national crime trends with pretty good precision as they occur. If murder stops dropping we’ll know it, if motor vehicle theft keeps plunging we’ll know it, if violent crime starts to level out we’ll know it.
The original Real-Time Crime Index site was always supposed to be phase one of a larger project, and I’m thrilled to announce that the Real-Time Crime Index has now become…drumroll…The Crime Index, available at CrimeIndex.org.
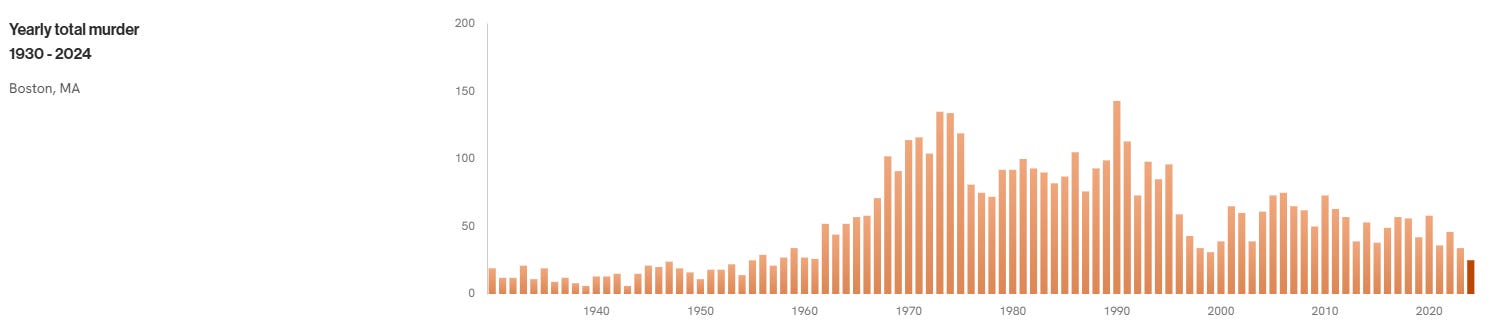
I got an email in late 2024 that changed the trajectory of this project. A reporter with the Boston Globe wanted to know when Boston had recorded fewer murders than the 24 that the police department reported in 2024.
I went to Jacob Kaplan’s excellent website, selected Massachusetts, and Boston’s murder trend since 1960 came right up. Boston had 26 murders in 1961 and 27 in 1960, but the digitized FBI data stops there and there were no years at or below 2024’s 24 murders between 1960 and 2023.
To answer this question, therefore, I had to turn to scanned PDFs of the FBI’s Crime in the United States (CIUS) report. It took looking at three PDFs to finally find 21 murders in Boston in 1957.

Doing this annoying exercise, I thought of the immortal words of Frank Costanza — “there had to be another way!”
Enter the idea for a brand new website! With incredible support from Arnold Ventures, we re-branded the Real-Time Crime Index as the Crime Index which, as I noted, is available now at CrimeIndex.org (the old site still redirects there).
The new site which has a brand new and even better interface with the data collected under the Real-Time Crime Index umbrella. We are now calling it Current Trends. This is the same sample of around 500 to 600 agencies of data nationwide each month with a new look that we think users will find easier to follow and glean data from. The sample is updated through April 2026 right now with 566 agencies nationwide.
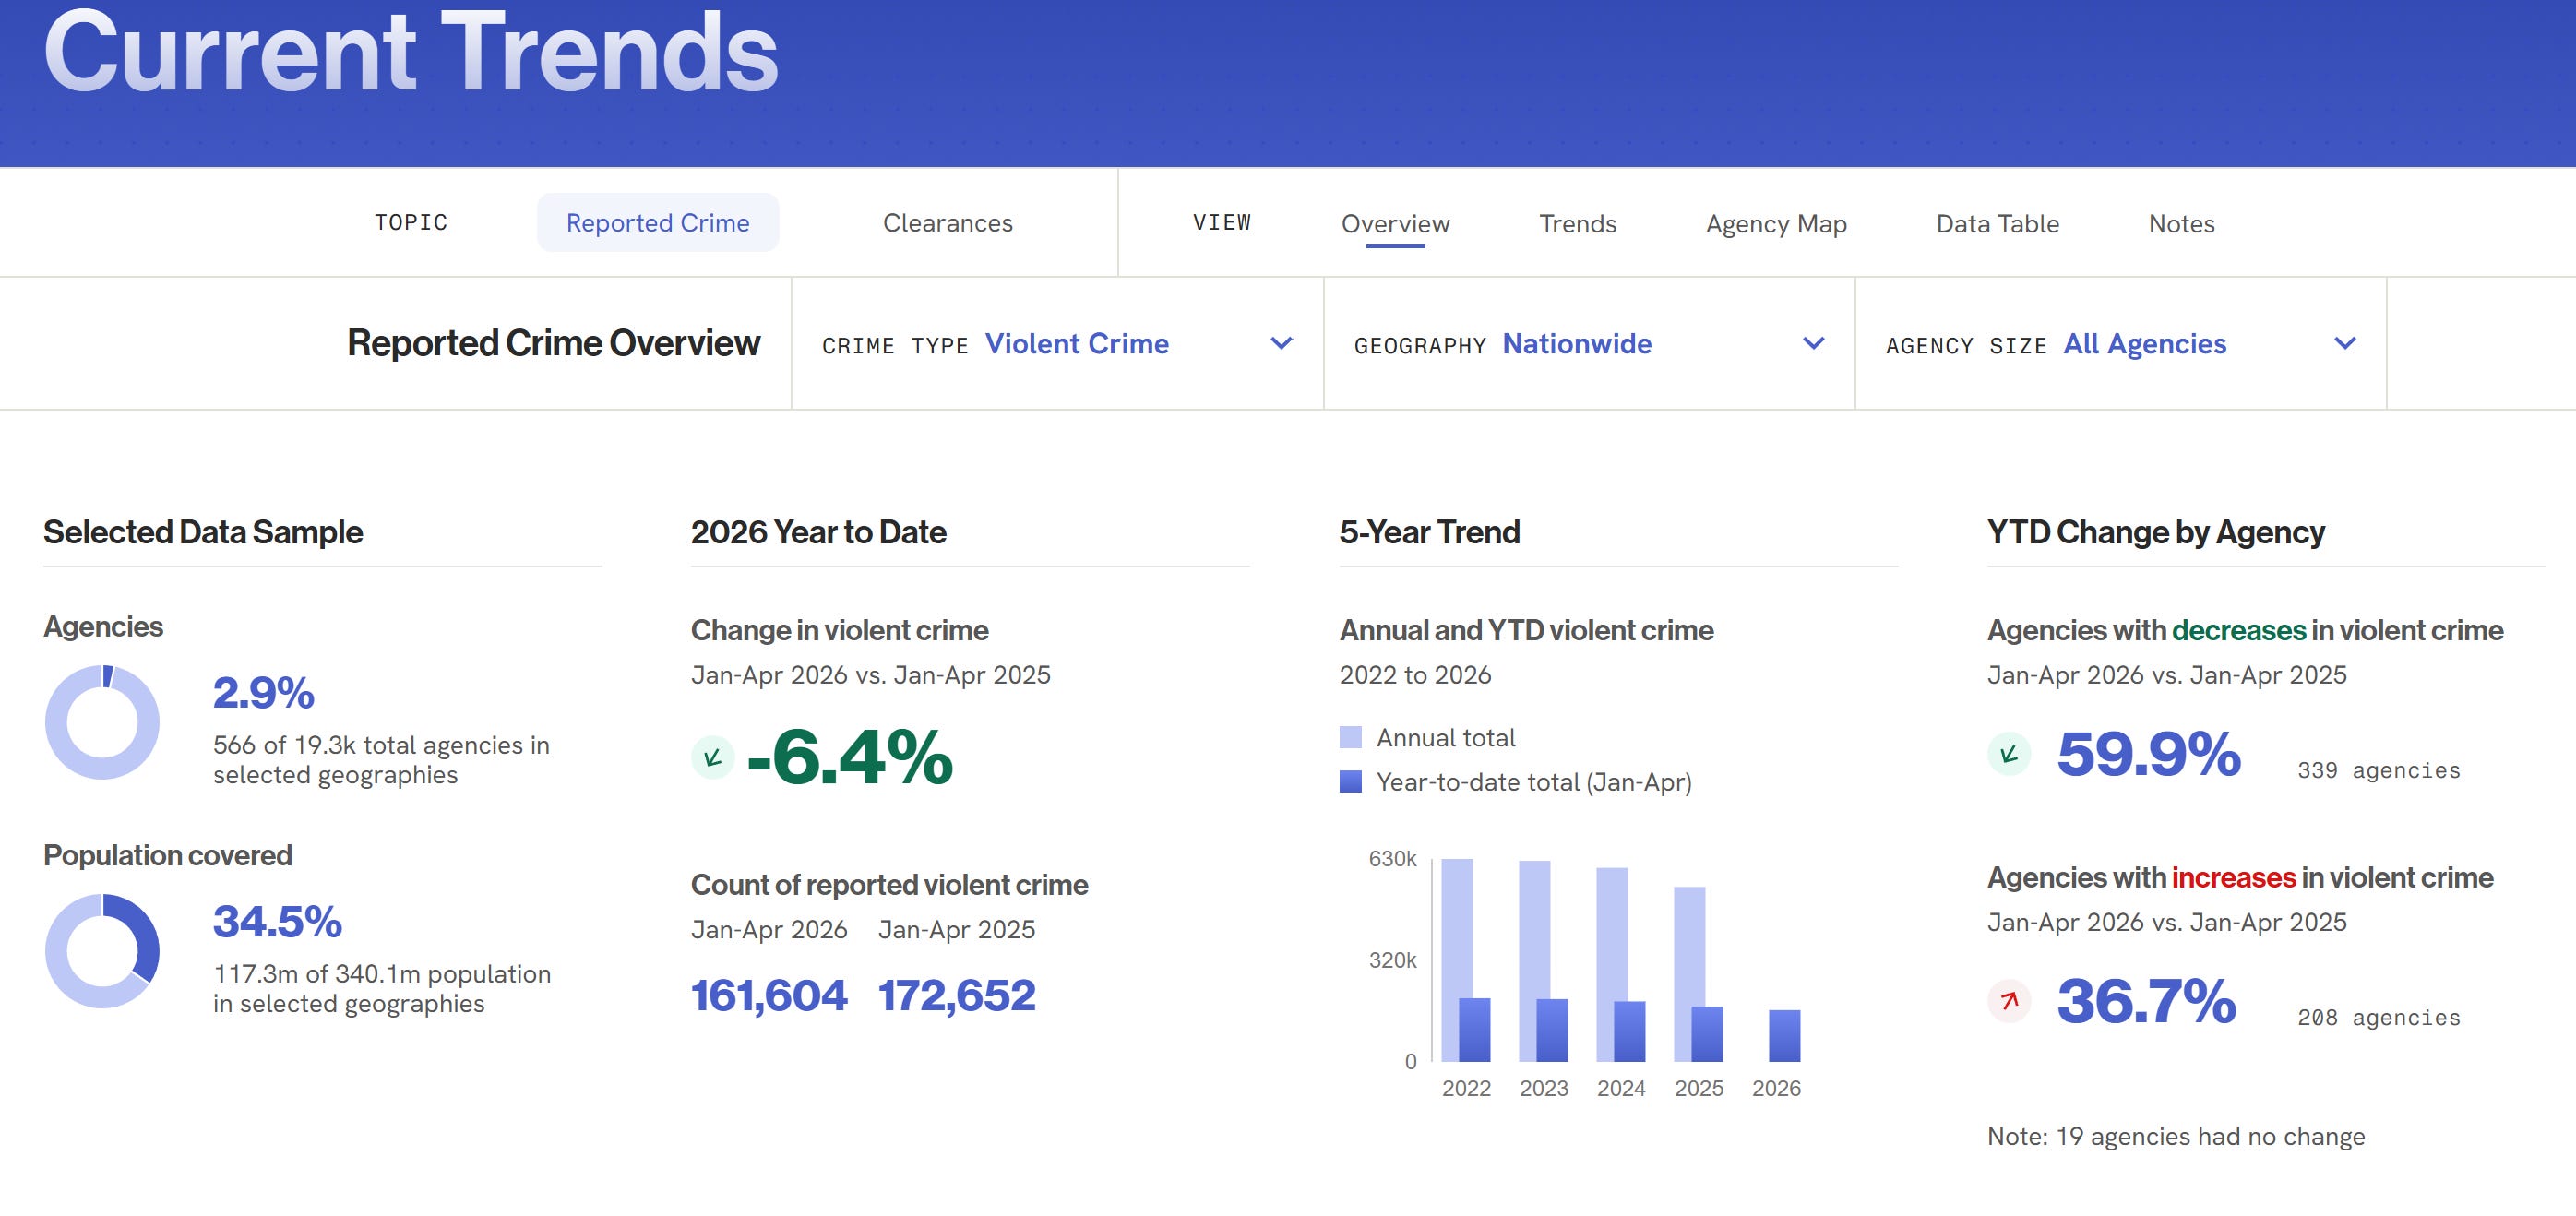
Using the Current Trends tool on the Crime Index you can see trends as they exist in the traditional RTCI sample at a national level…
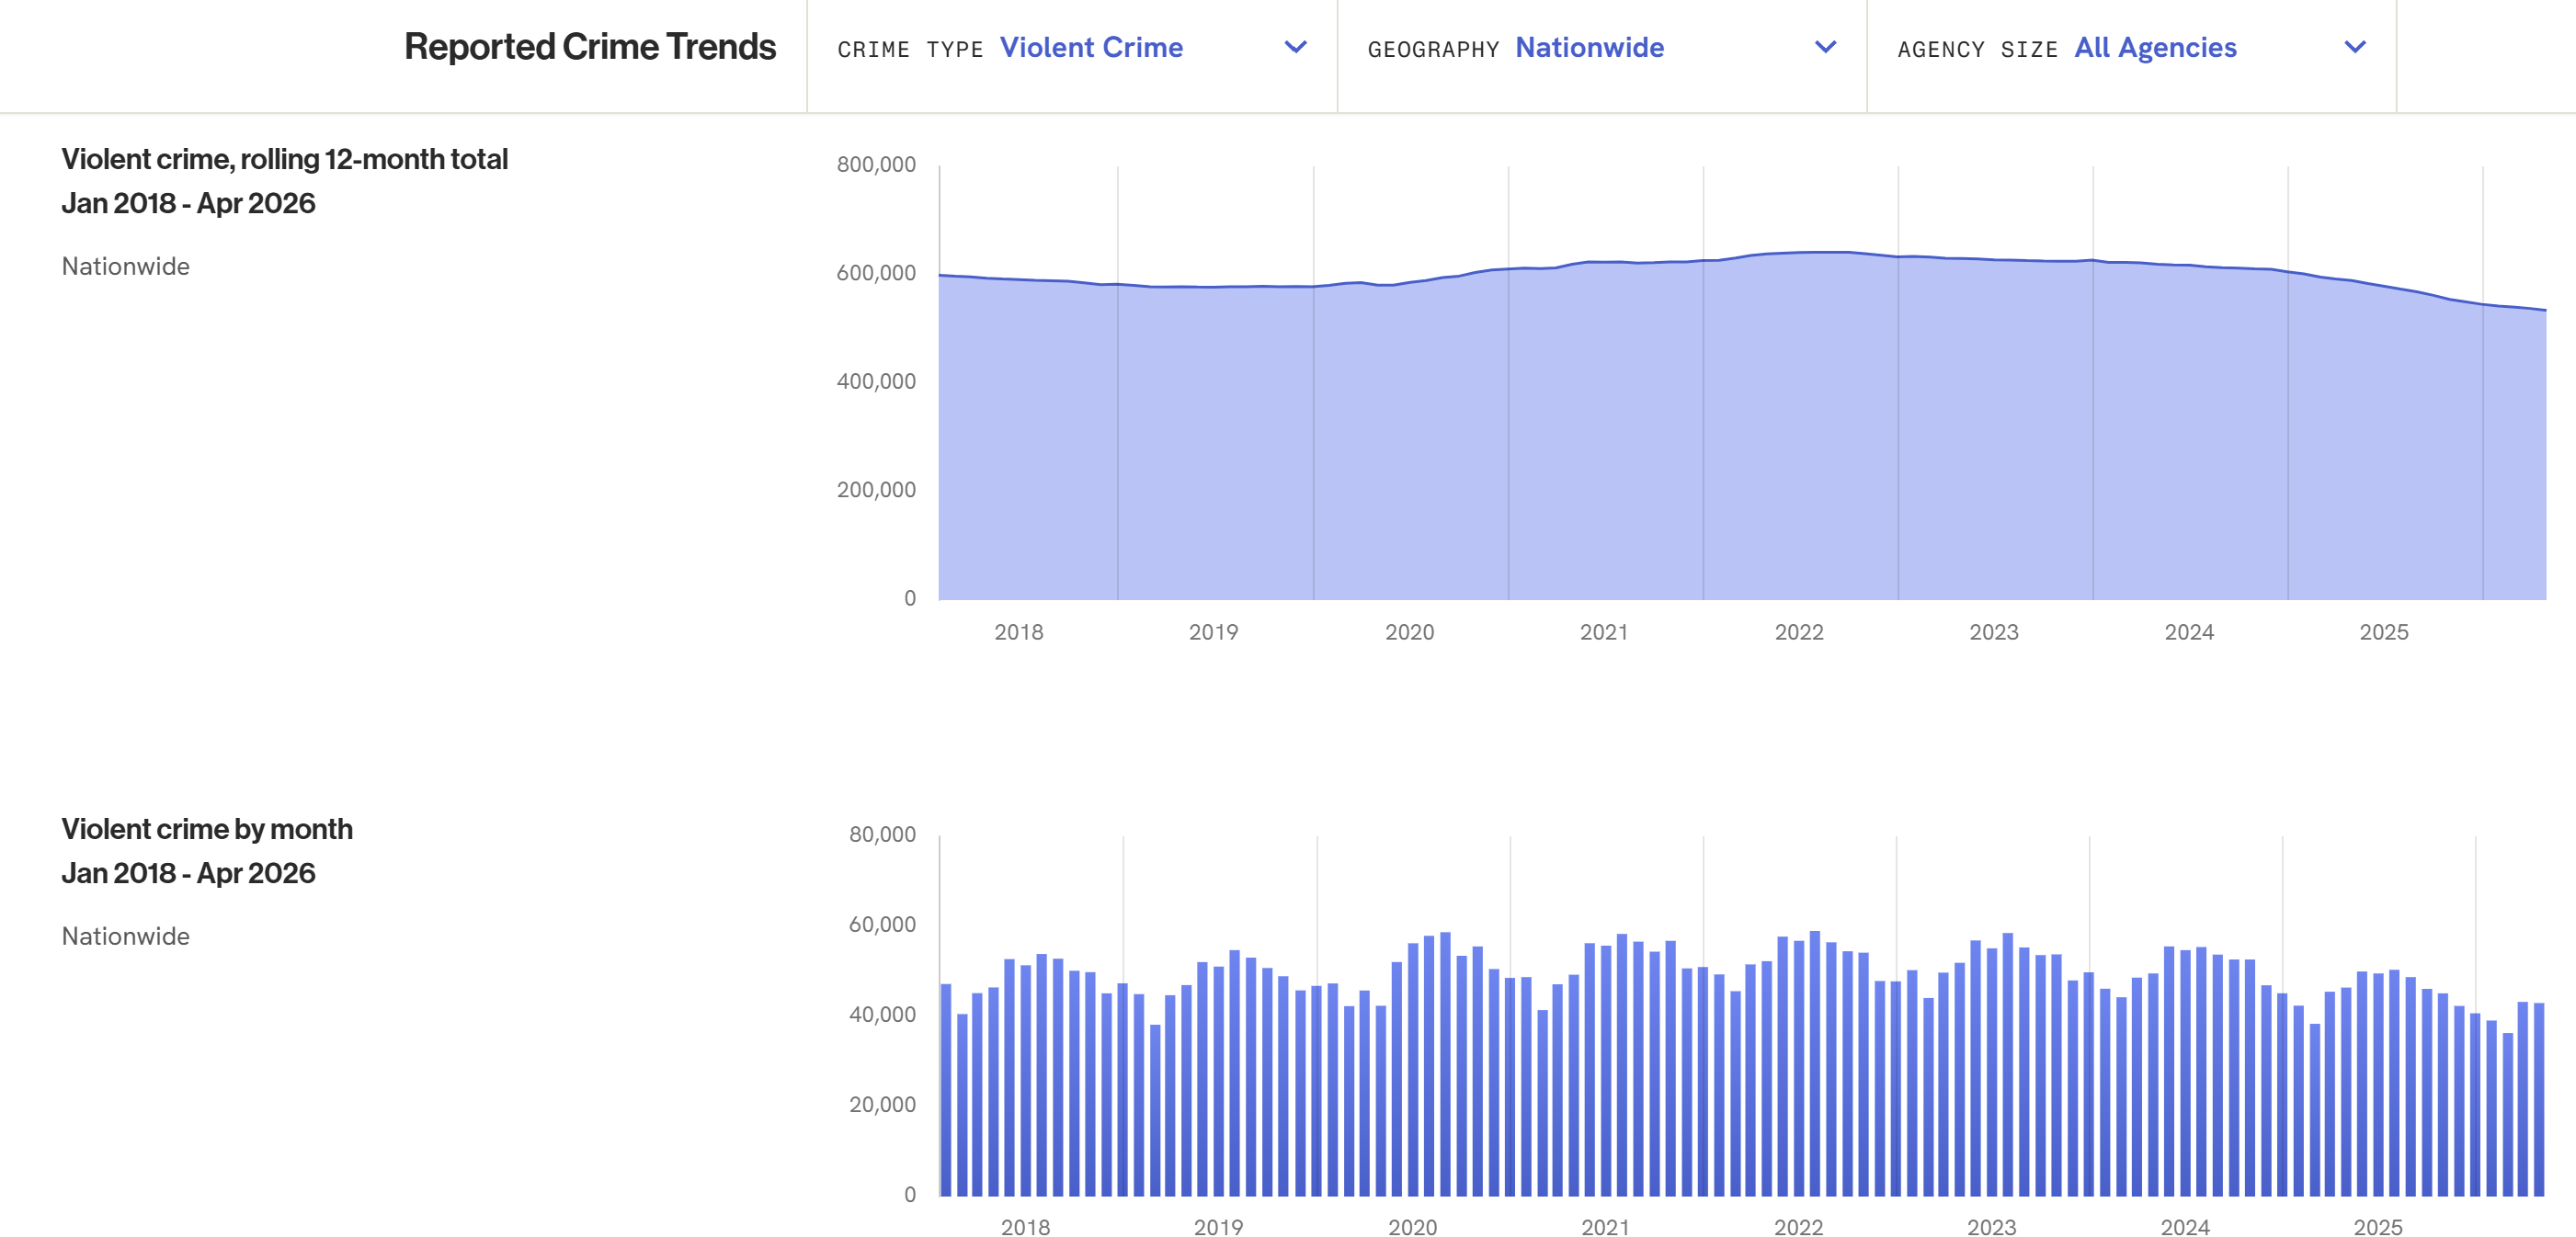
And agency level for the 700+ agencies with data in what used to be the Real-Time Crime Index (note that not every agency always has complete data). You can also add annotations handily to show how YTD trends have changed for every available year.
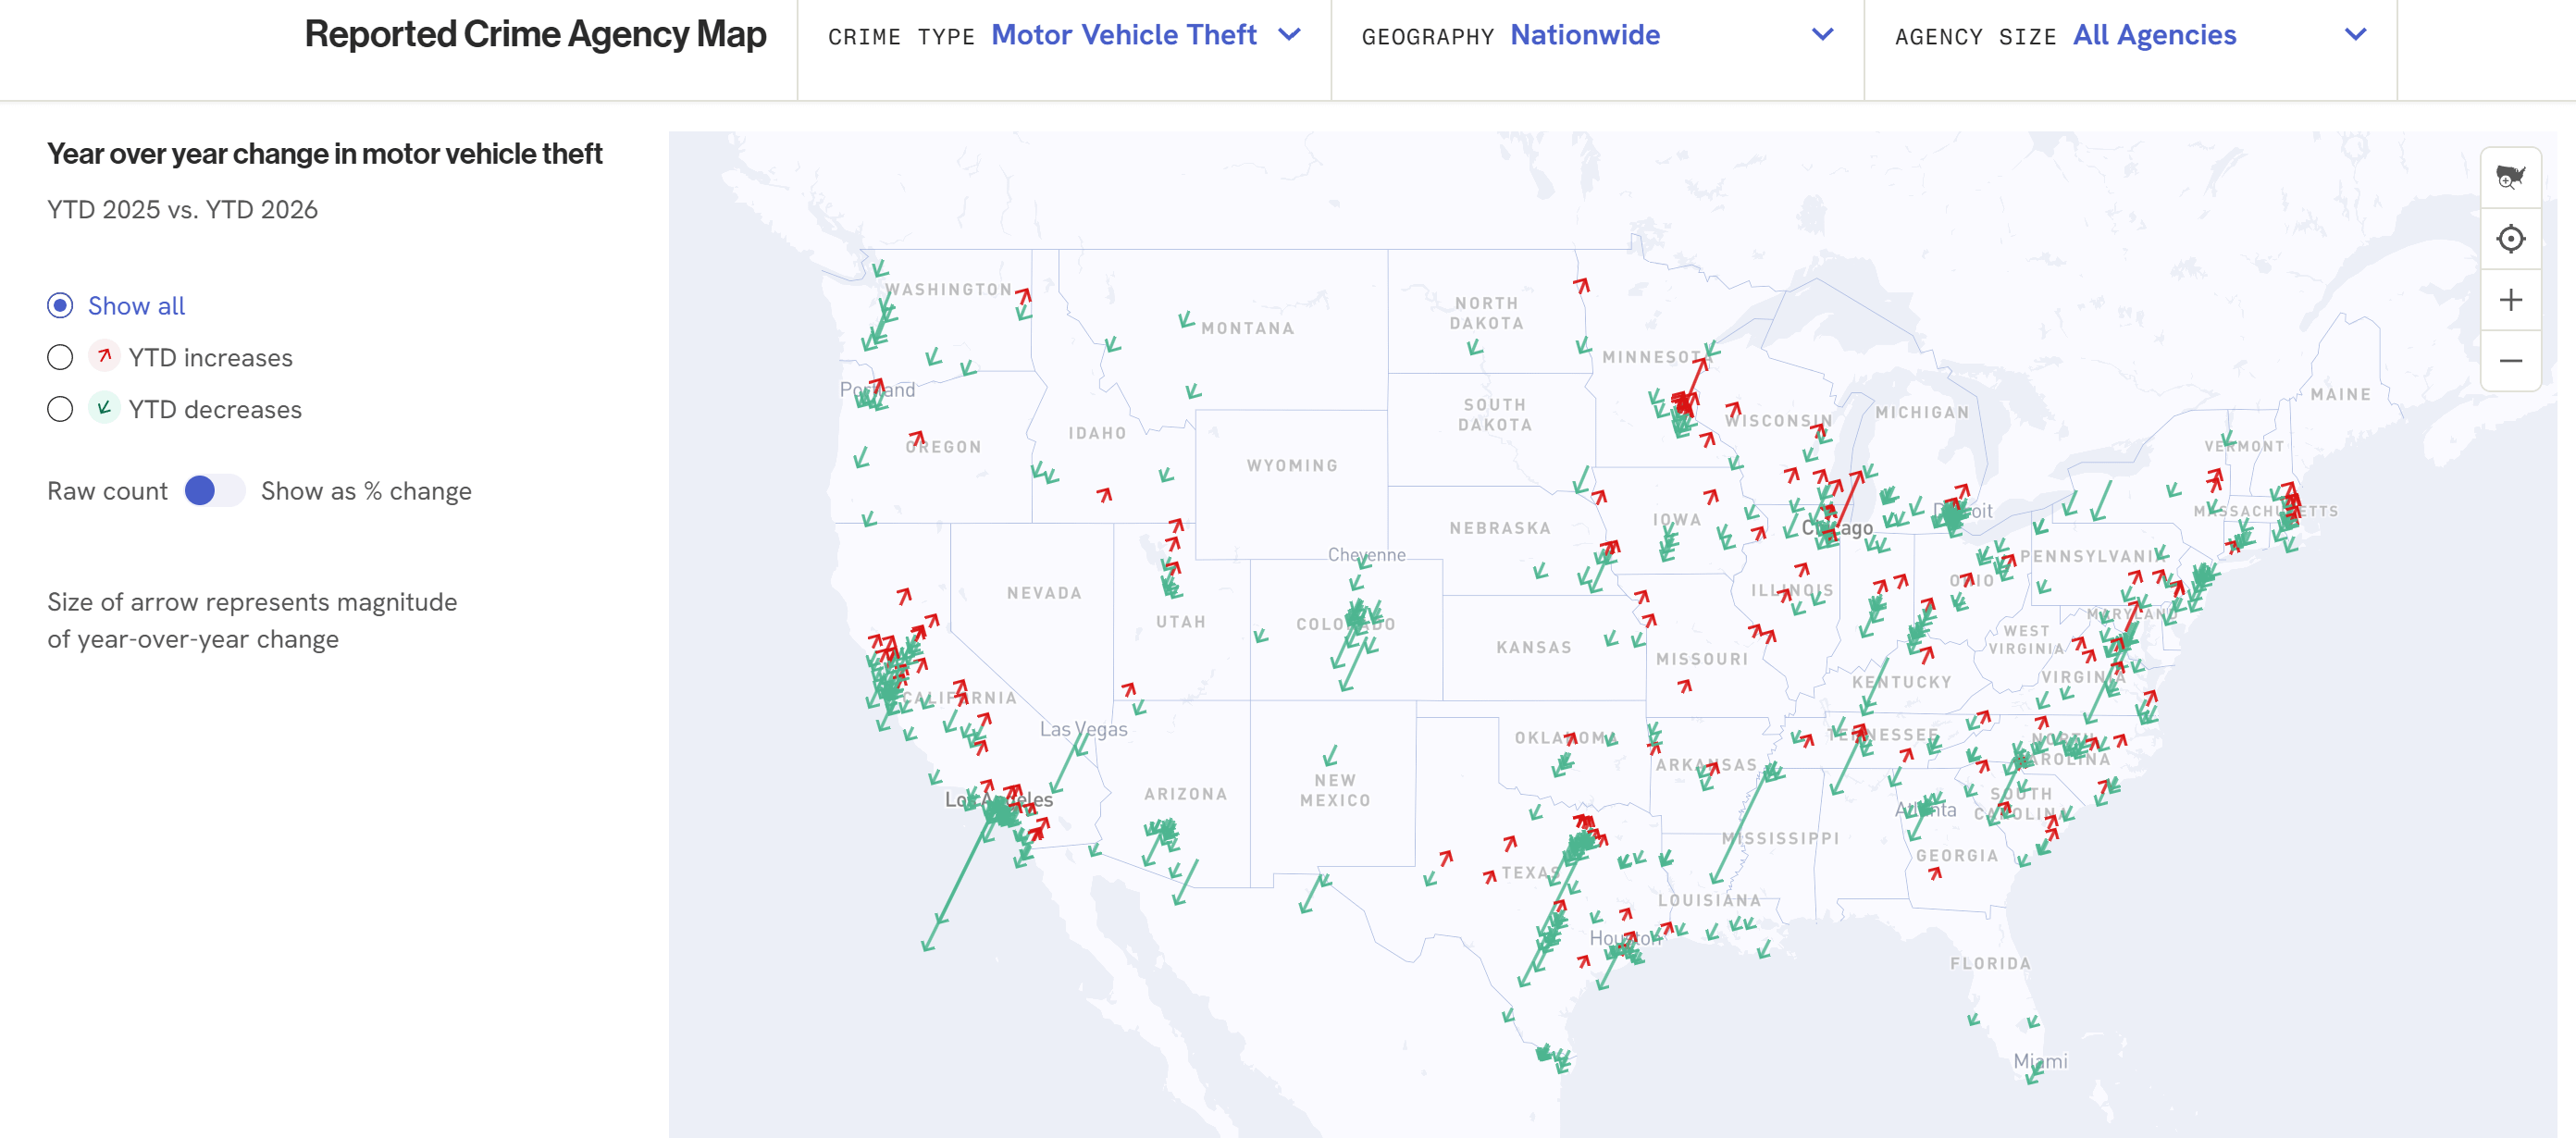
We’ve also added new ways to visualize the data in the national sample. For instance, you can see how crime is changing nationally on a map…
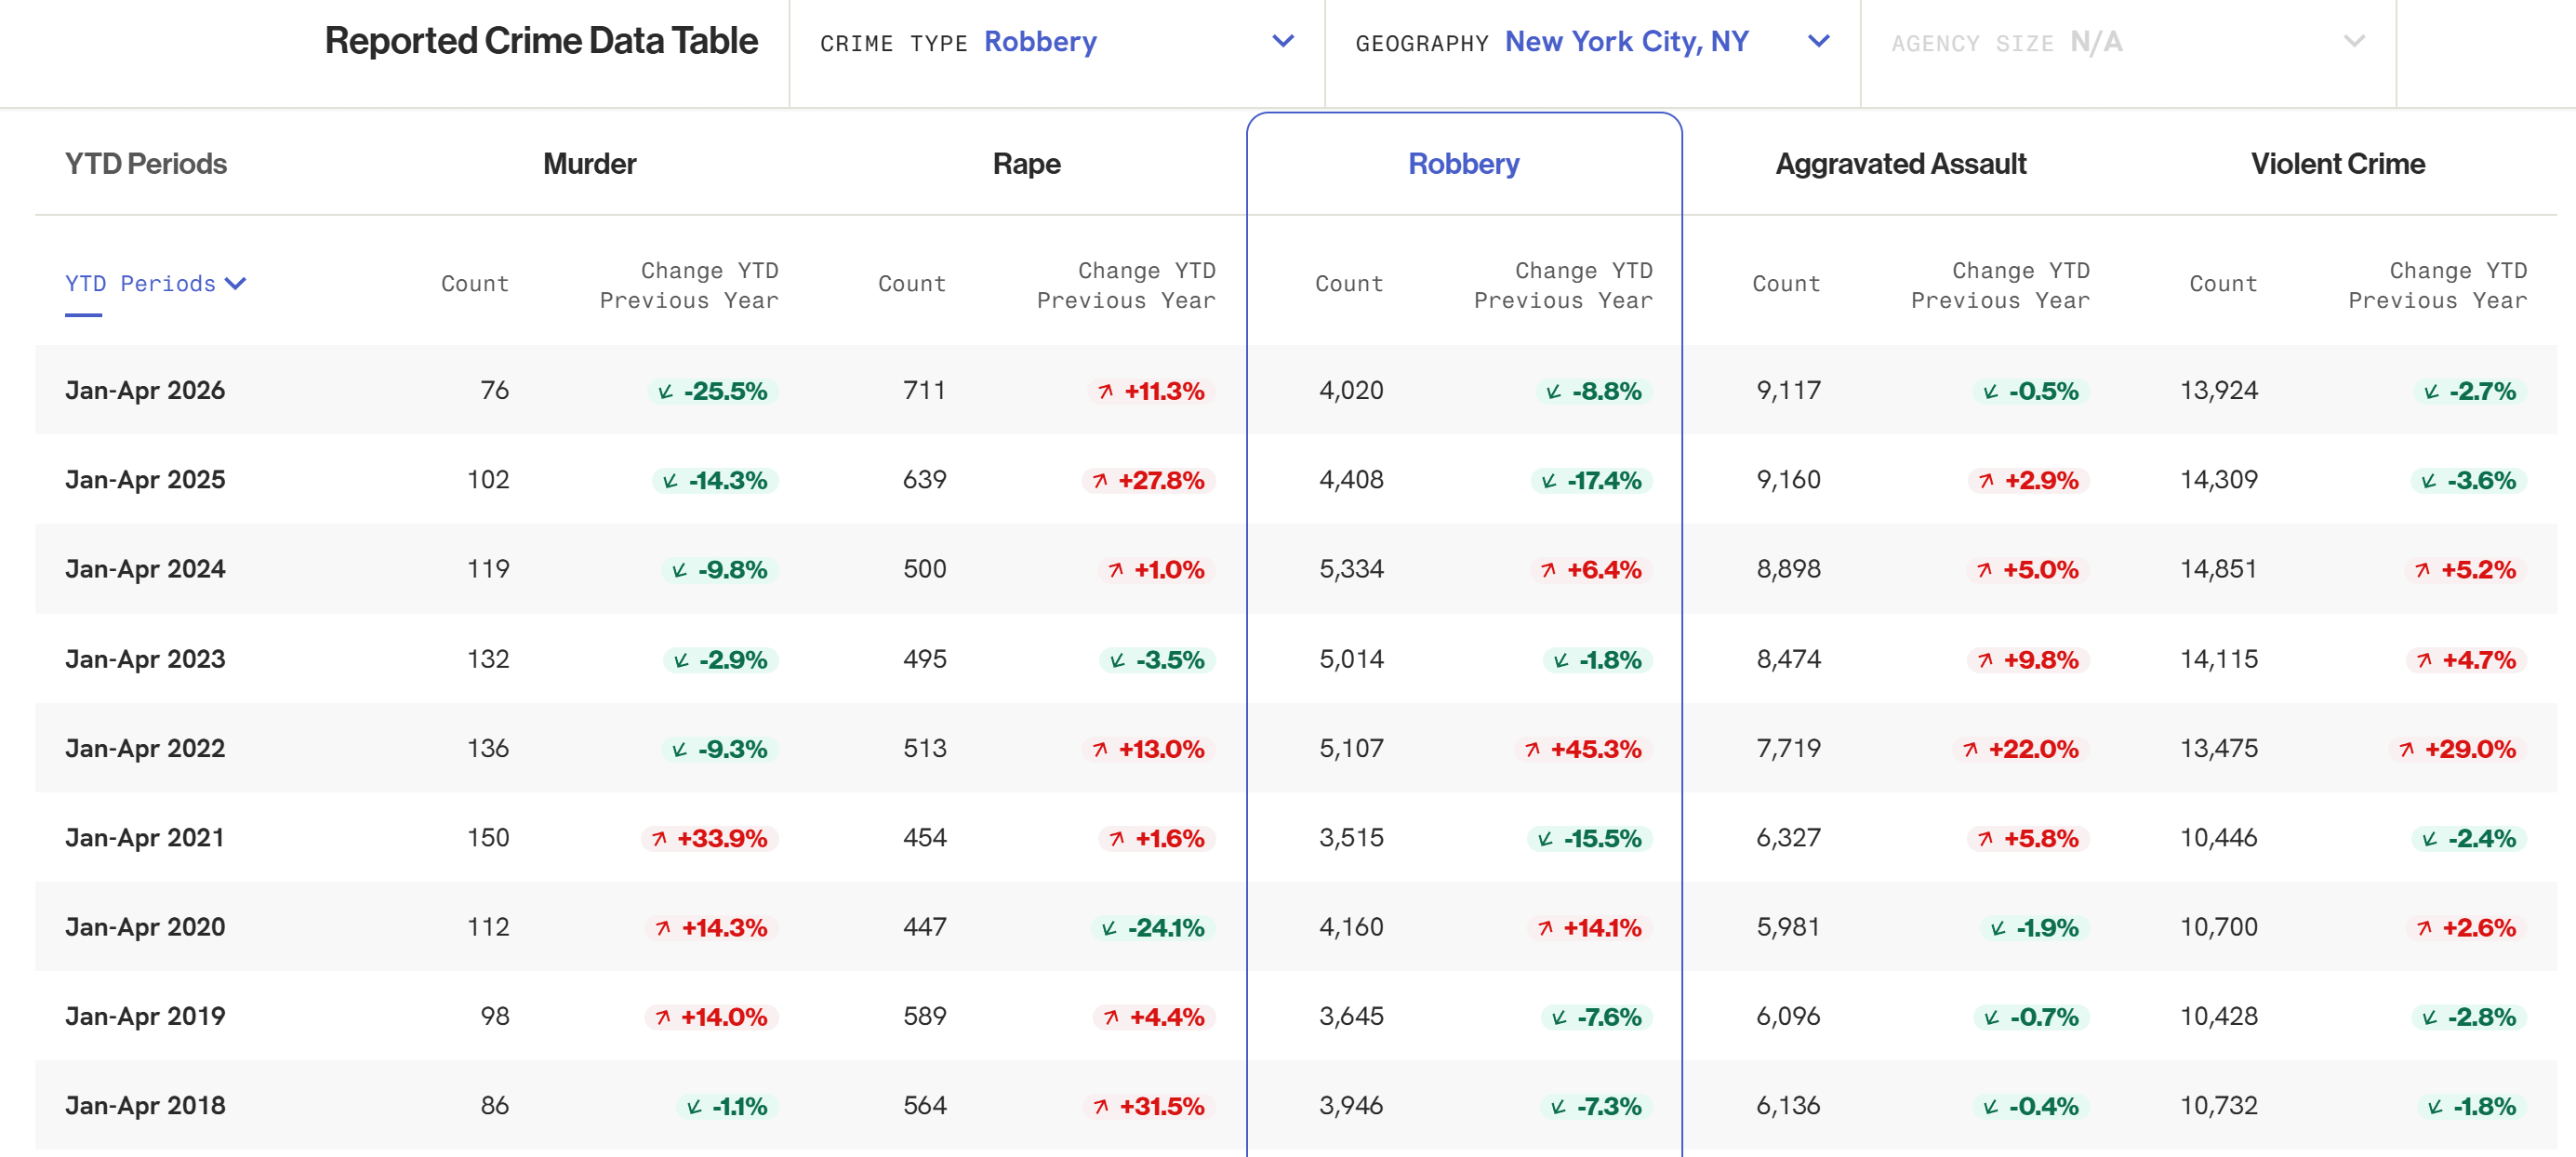
And access data tables very easily.
But that’s not all!
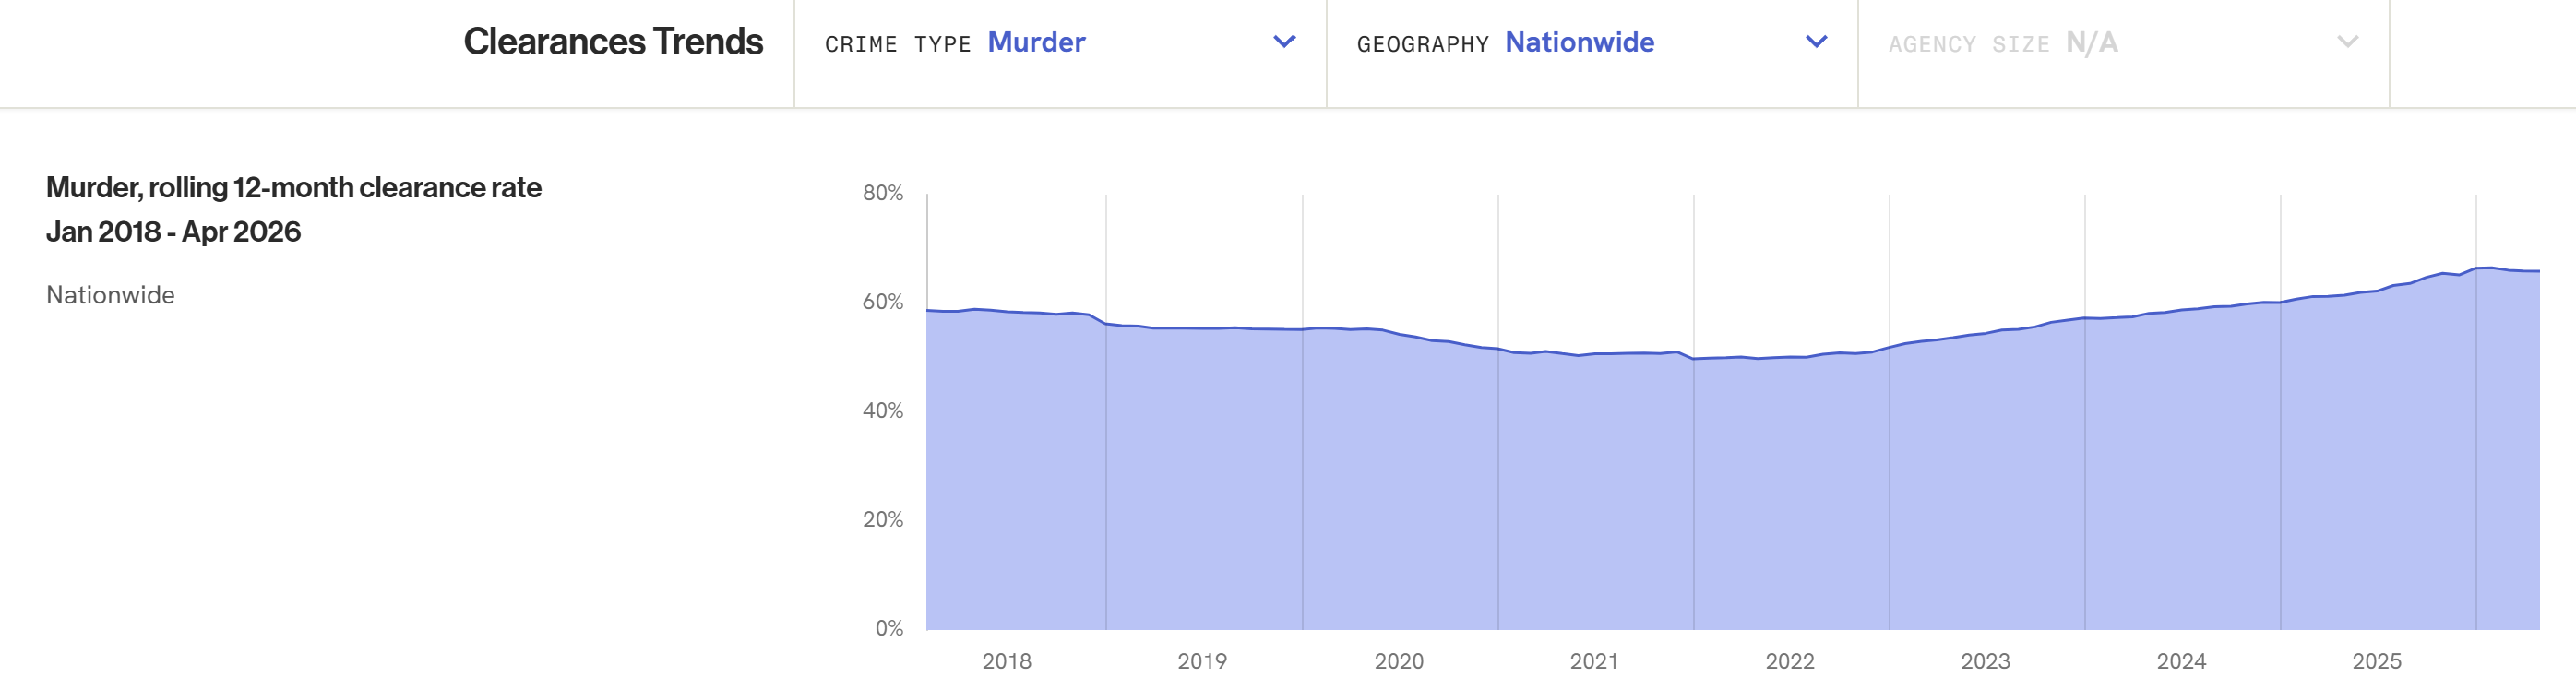
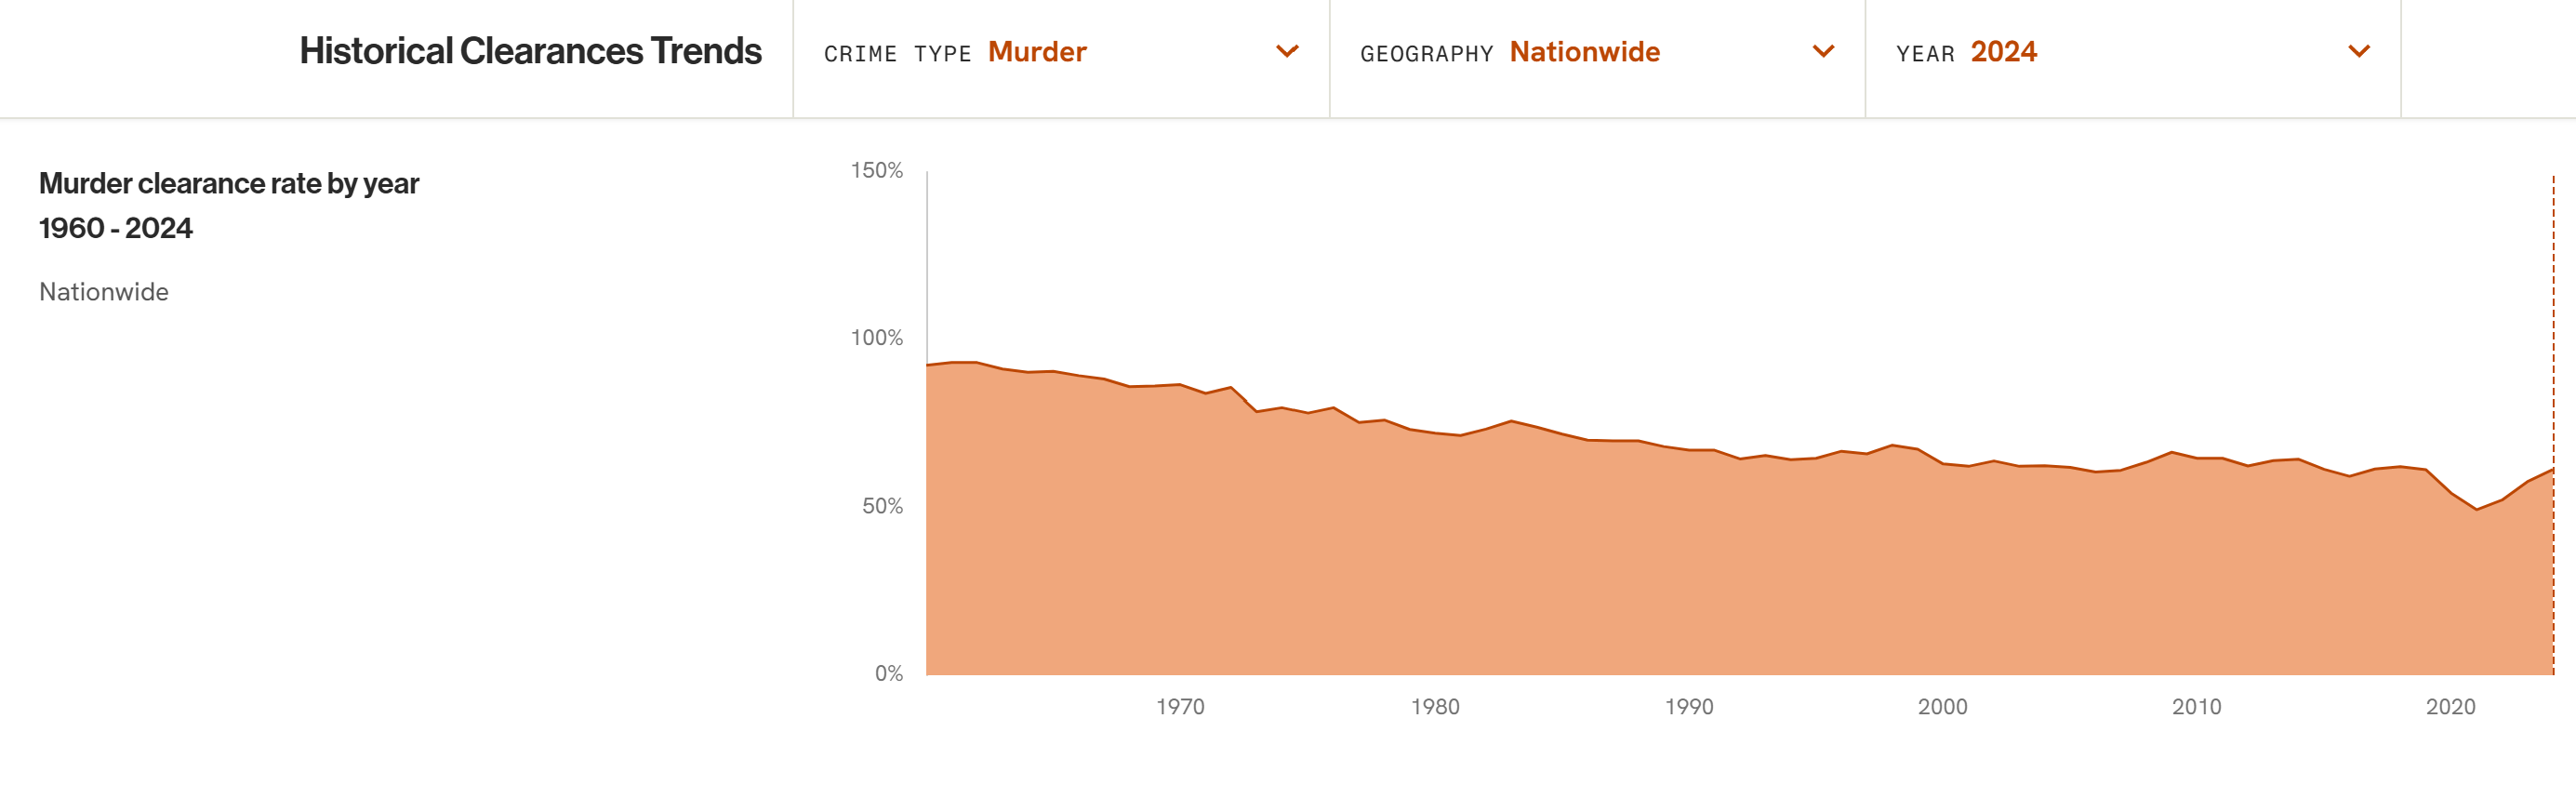
We have built in functionality to measure changing clearance rates at a national and agency level relying mainly on data from the Crime Data Explorer. There’s a national clearance rate which is derived from every agency reporting data to the FBI so it should relatively closely mimic national trends.
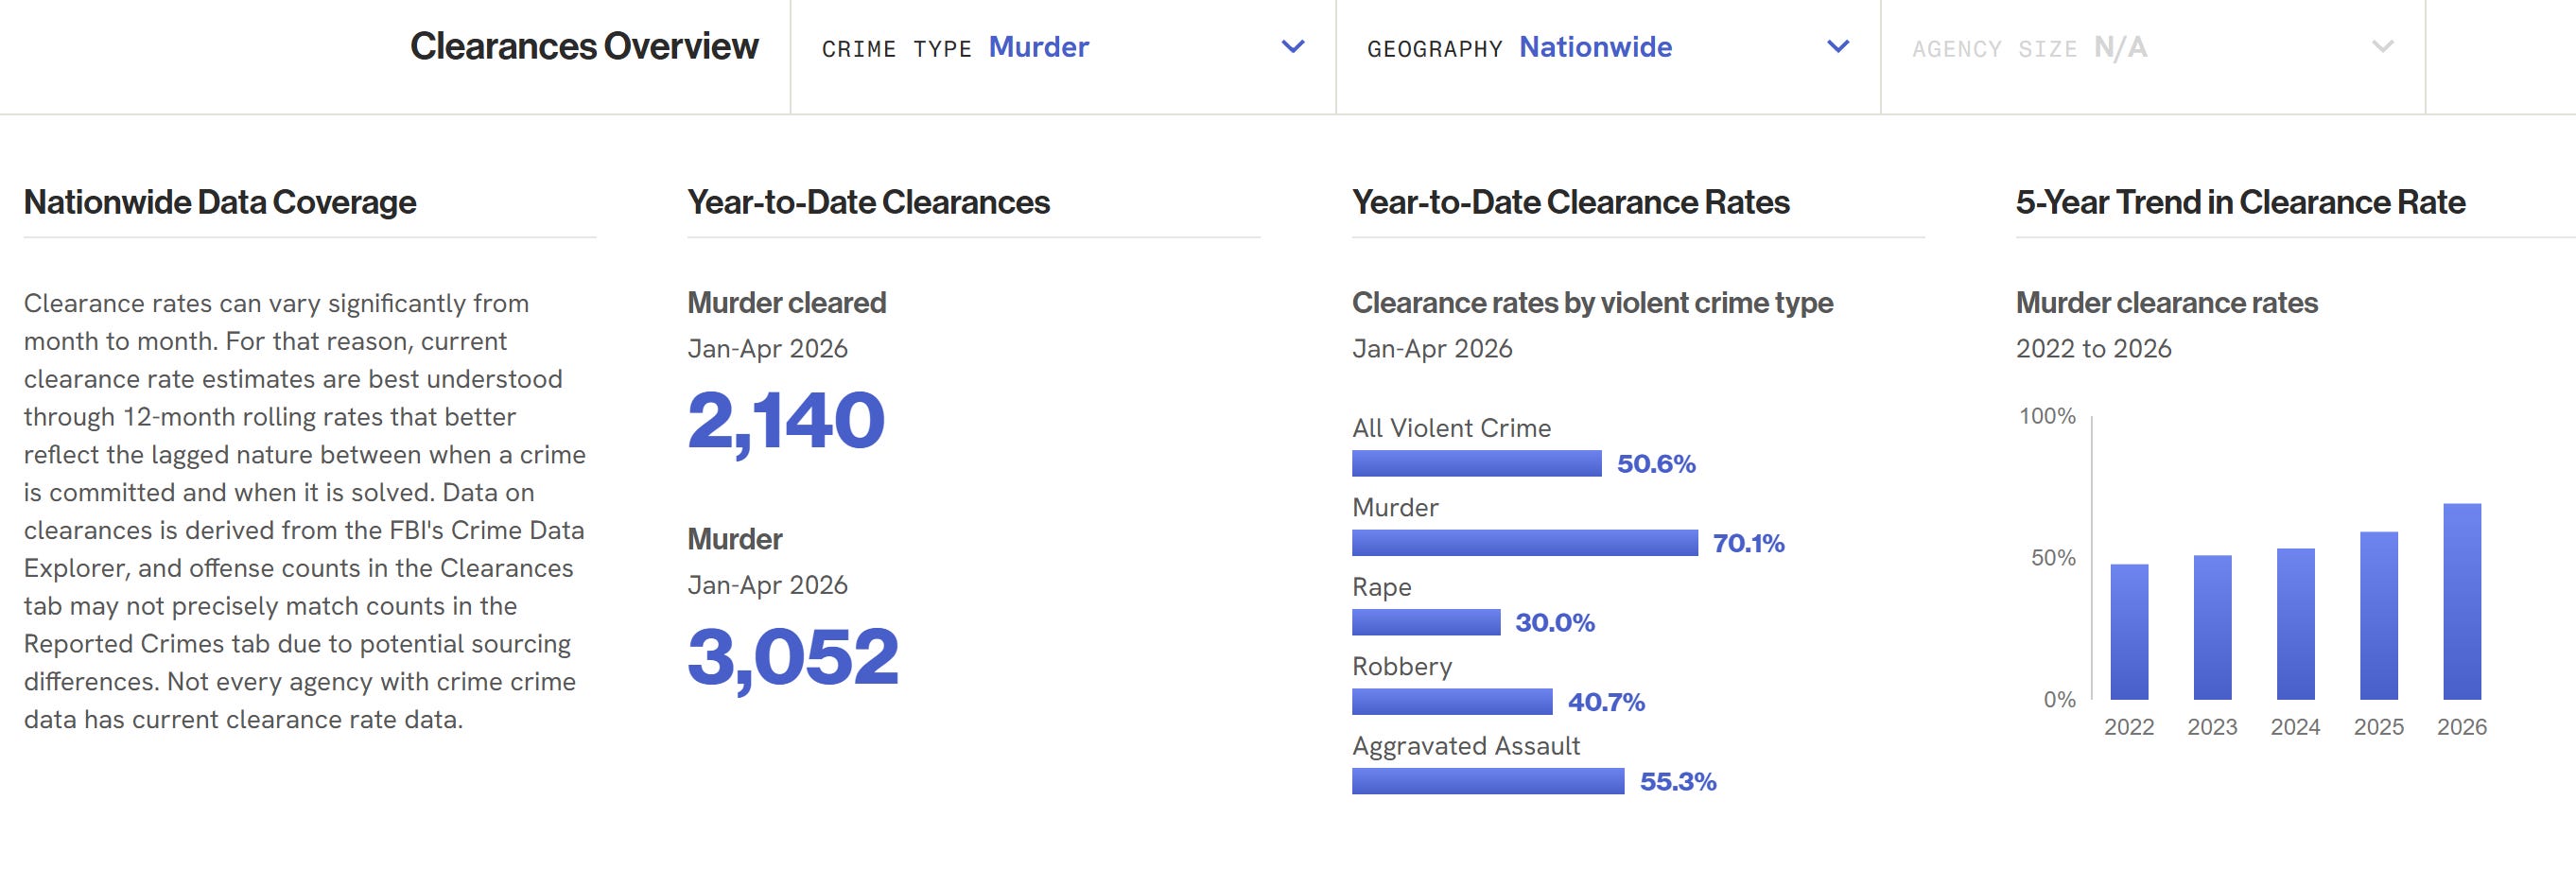
You can see how clearance rates are changing at a national level as they change over time. Using this data, we can see with confidence the plunge in national murder clearance rates between 2020 and 2022 followed by a big surge in them through 2025 that appears to have leveled off.
There’s even more! A lot more!
We have built what we’re calling the Historical Data Library which is a collection of crime data dating back to 1930. The Crime Index now holds the largest collection of crime data, all in one place, going back nearly a century. Anybody who wants to can easily answer that Boston question!
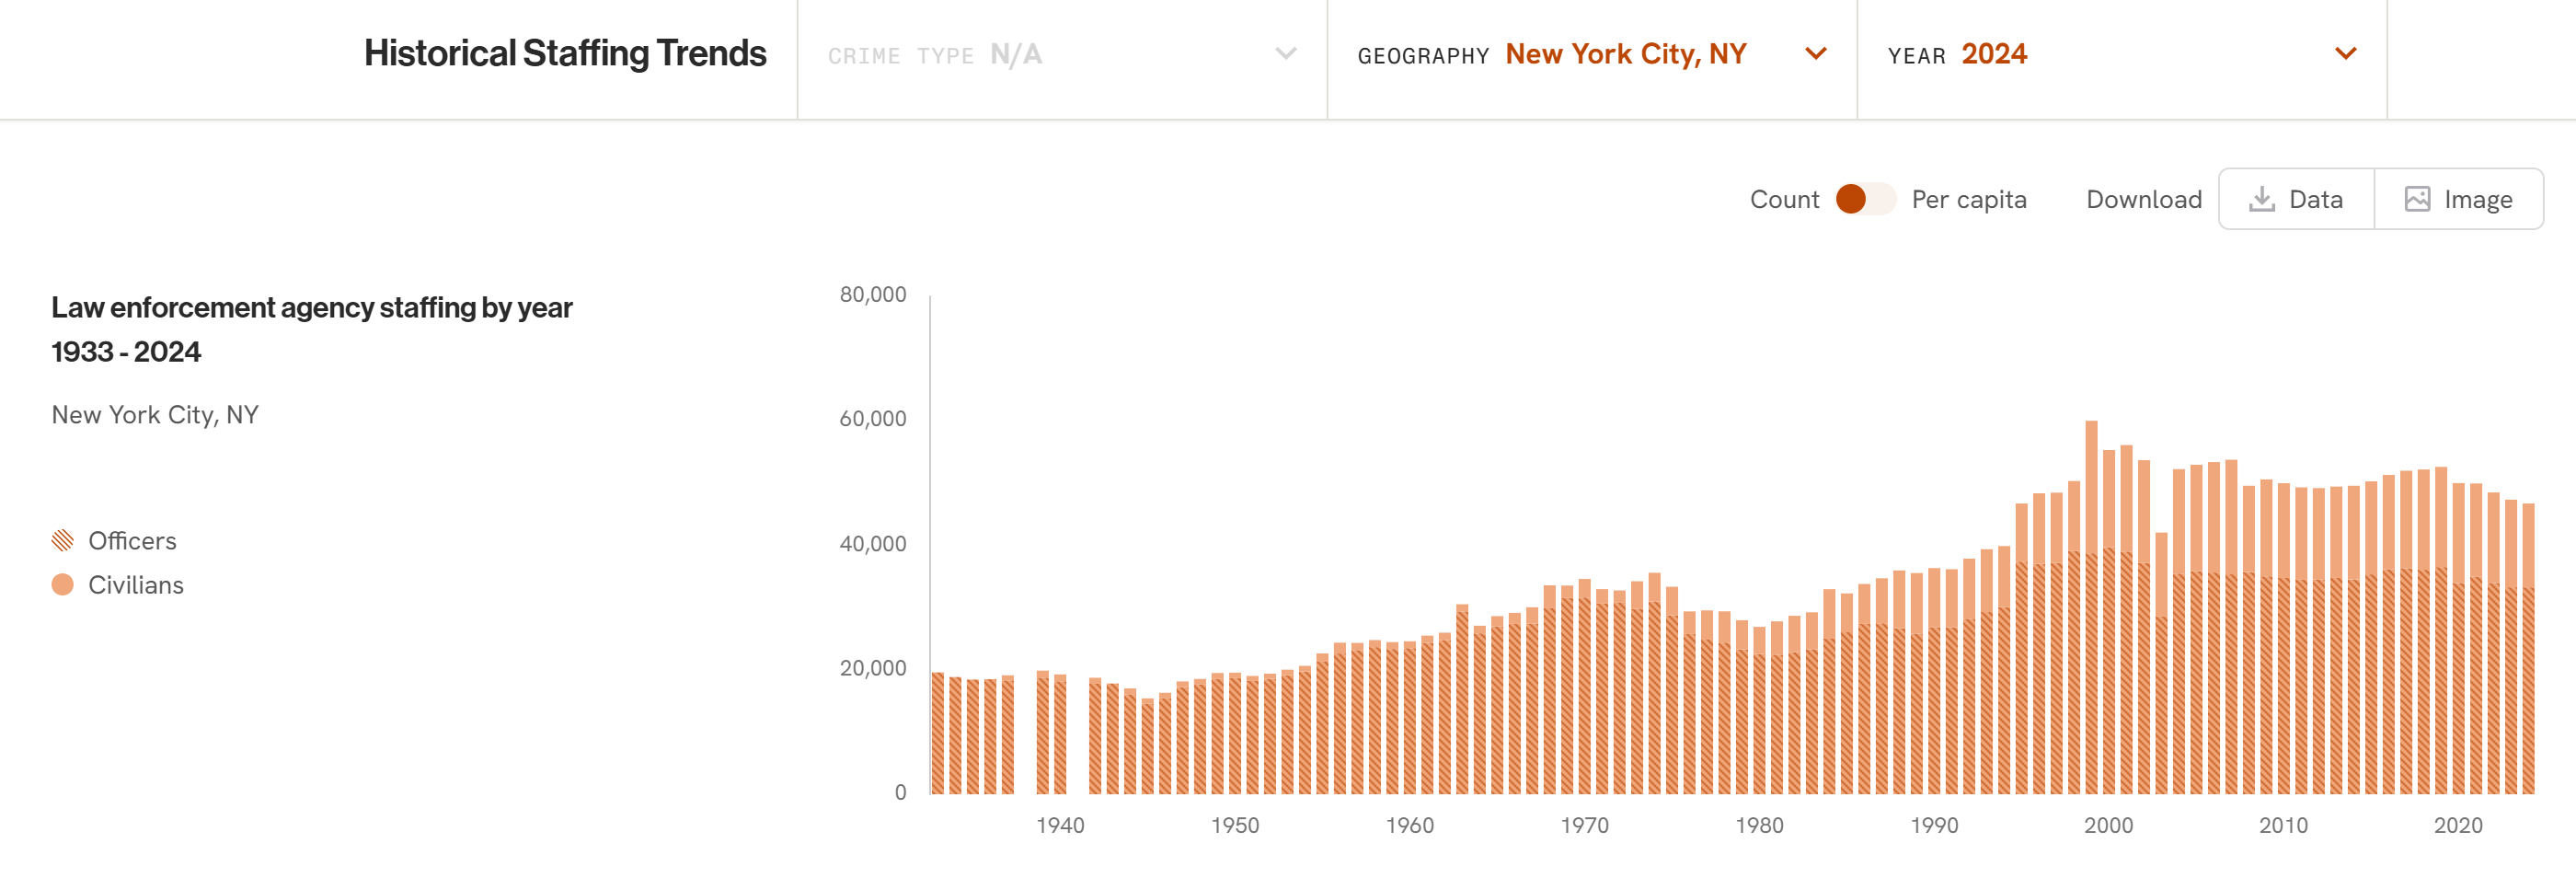
I mentioned this a few weeks back when I talked about the Crime Data Assistant, but we worked with Jacob Kaplan to scrape all of the old FBI PDFs back to 1930. This wasn’t fun, but the result is the ability to provide agency-level data for many agencies going back to the first time the FBI ever published crime data in 1930. We also grabbed staffing data with the number of officers and civilians for many agencies back to 1930, and we have clearance rate data to 1958 — the first time the FBI reported national estimates at a “modern” standard.
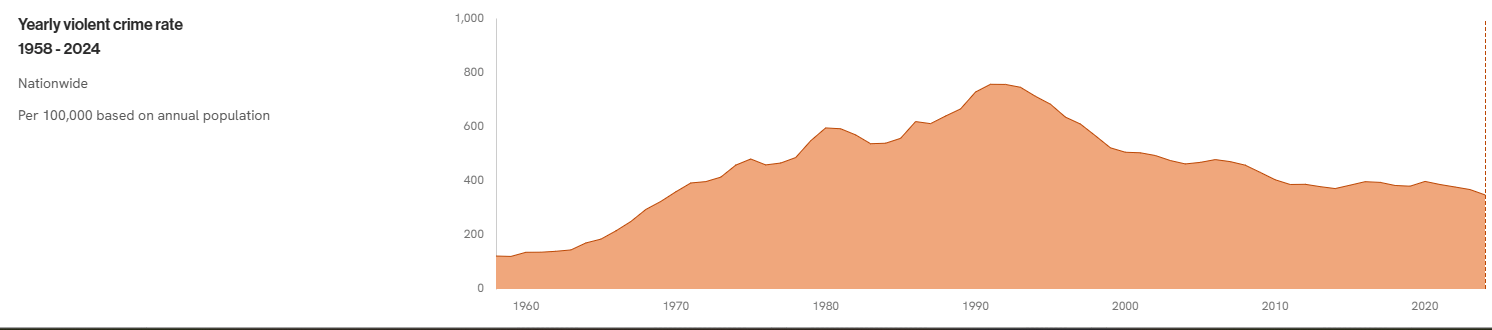
The Historical Data Library covers formally reported FBI data, and along with the agency-level data we have national and state crime estimates going back to 1958. Here you can easily see how the nation’s violent crime rate in 1960 compares to the most recent formal estimate from the FBI (2024 nationally as of now, soon to be 2025)…
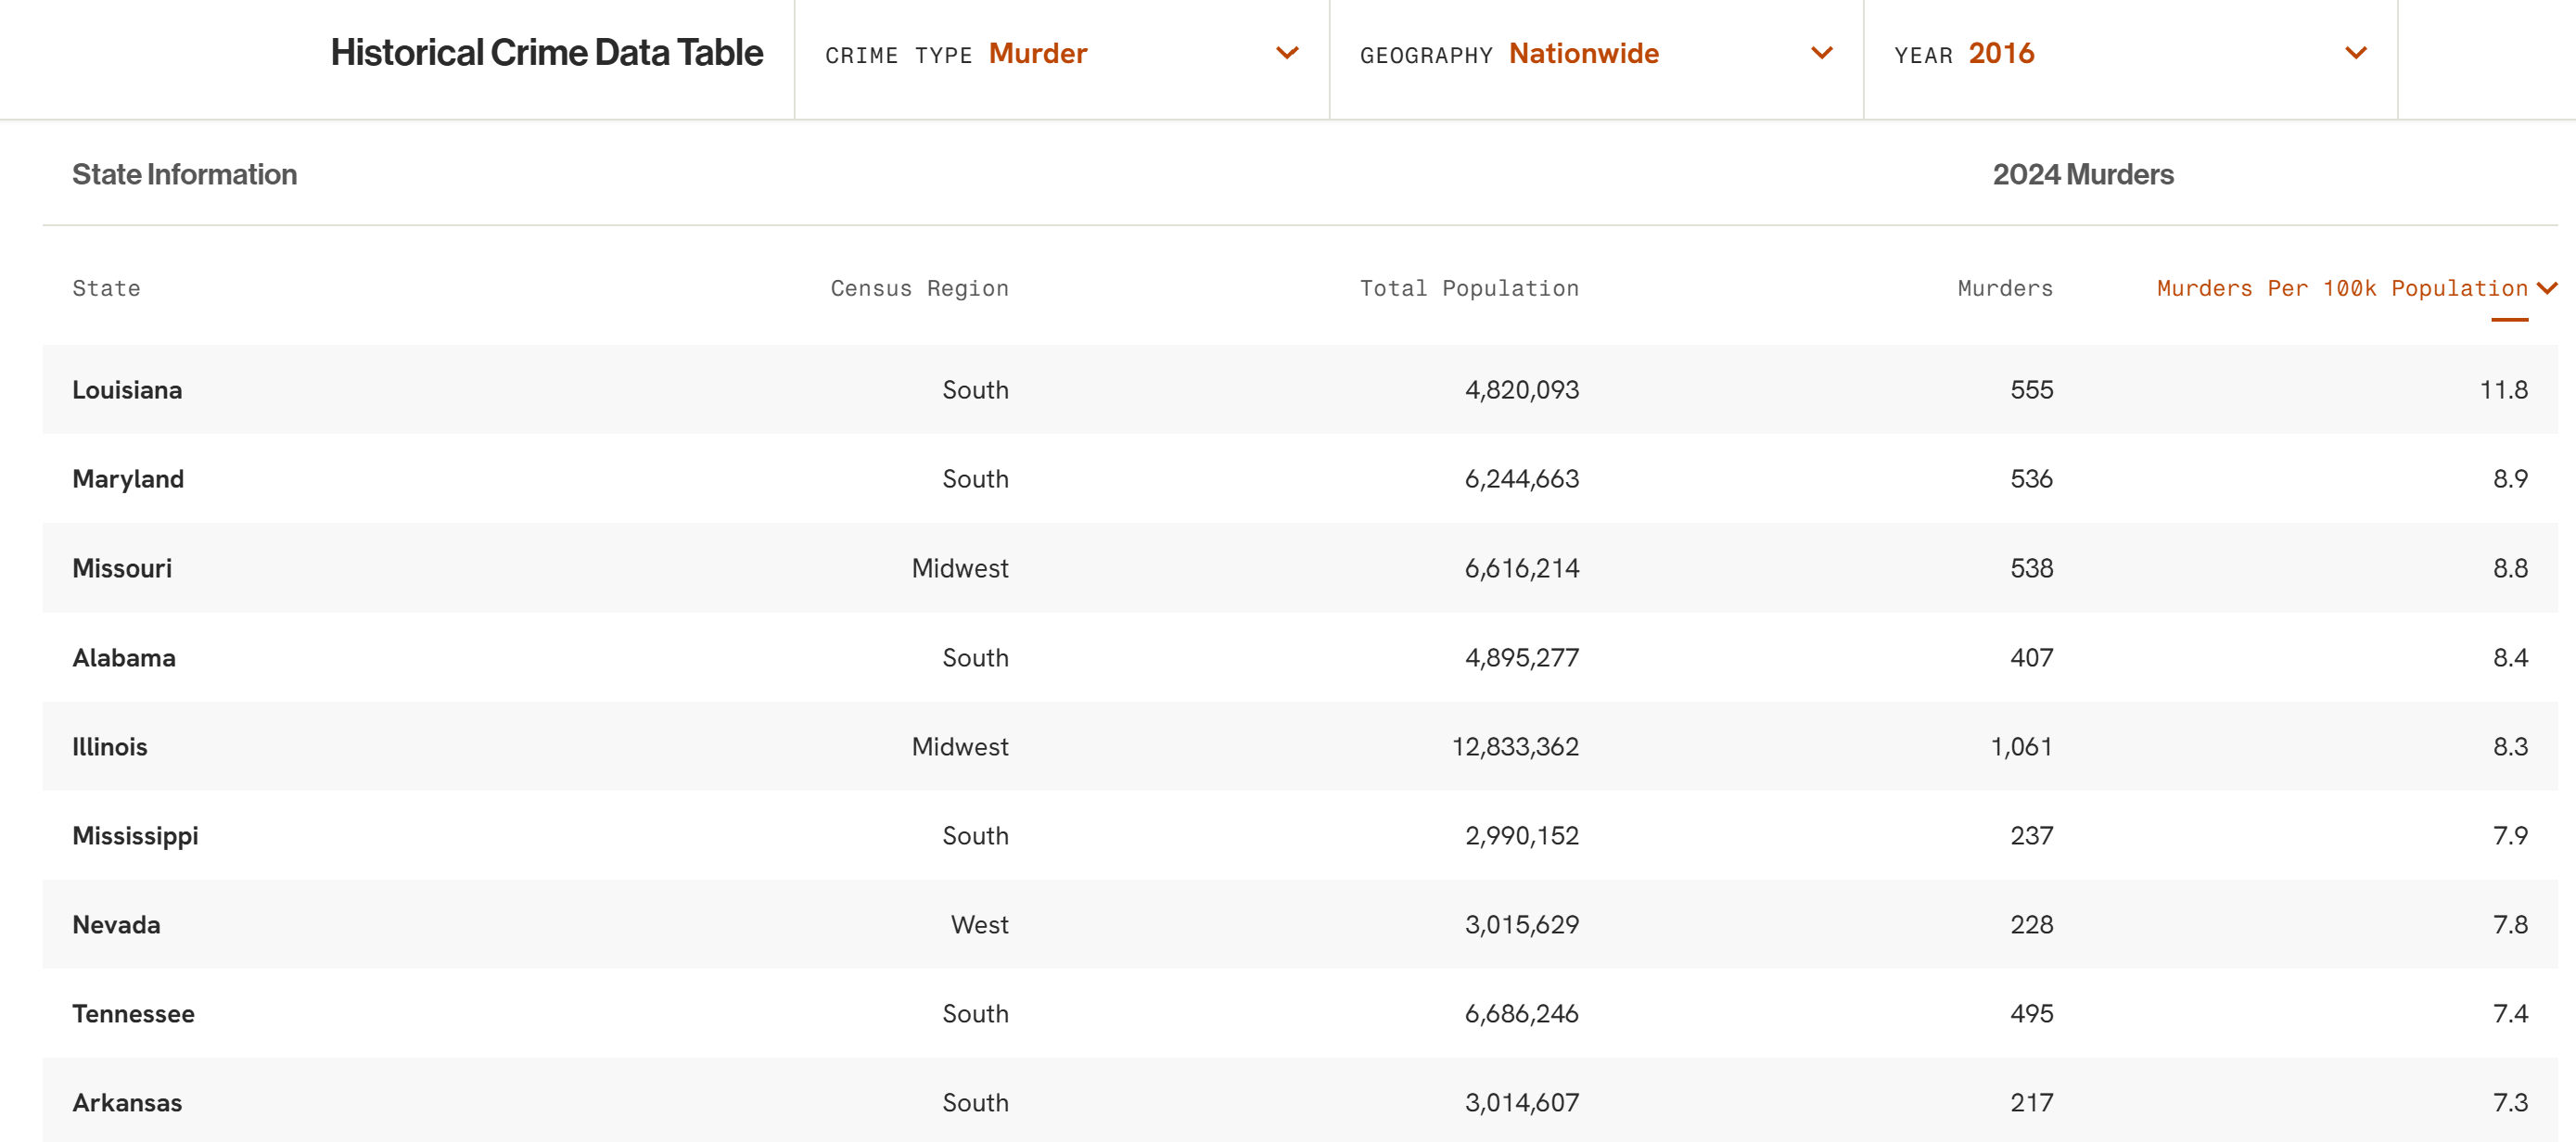
See which state had the highest murder rate in the country in 2016 (spoiler: it was Louisiana)…
Or you can view historical crime data from more than 10,000 city and county agencies.
You can see national clearance rates since 1960 — taking into account the unreliability of pre-Miranda clearance rates of course. You can go back to 1960 and look at a national clearance rates…
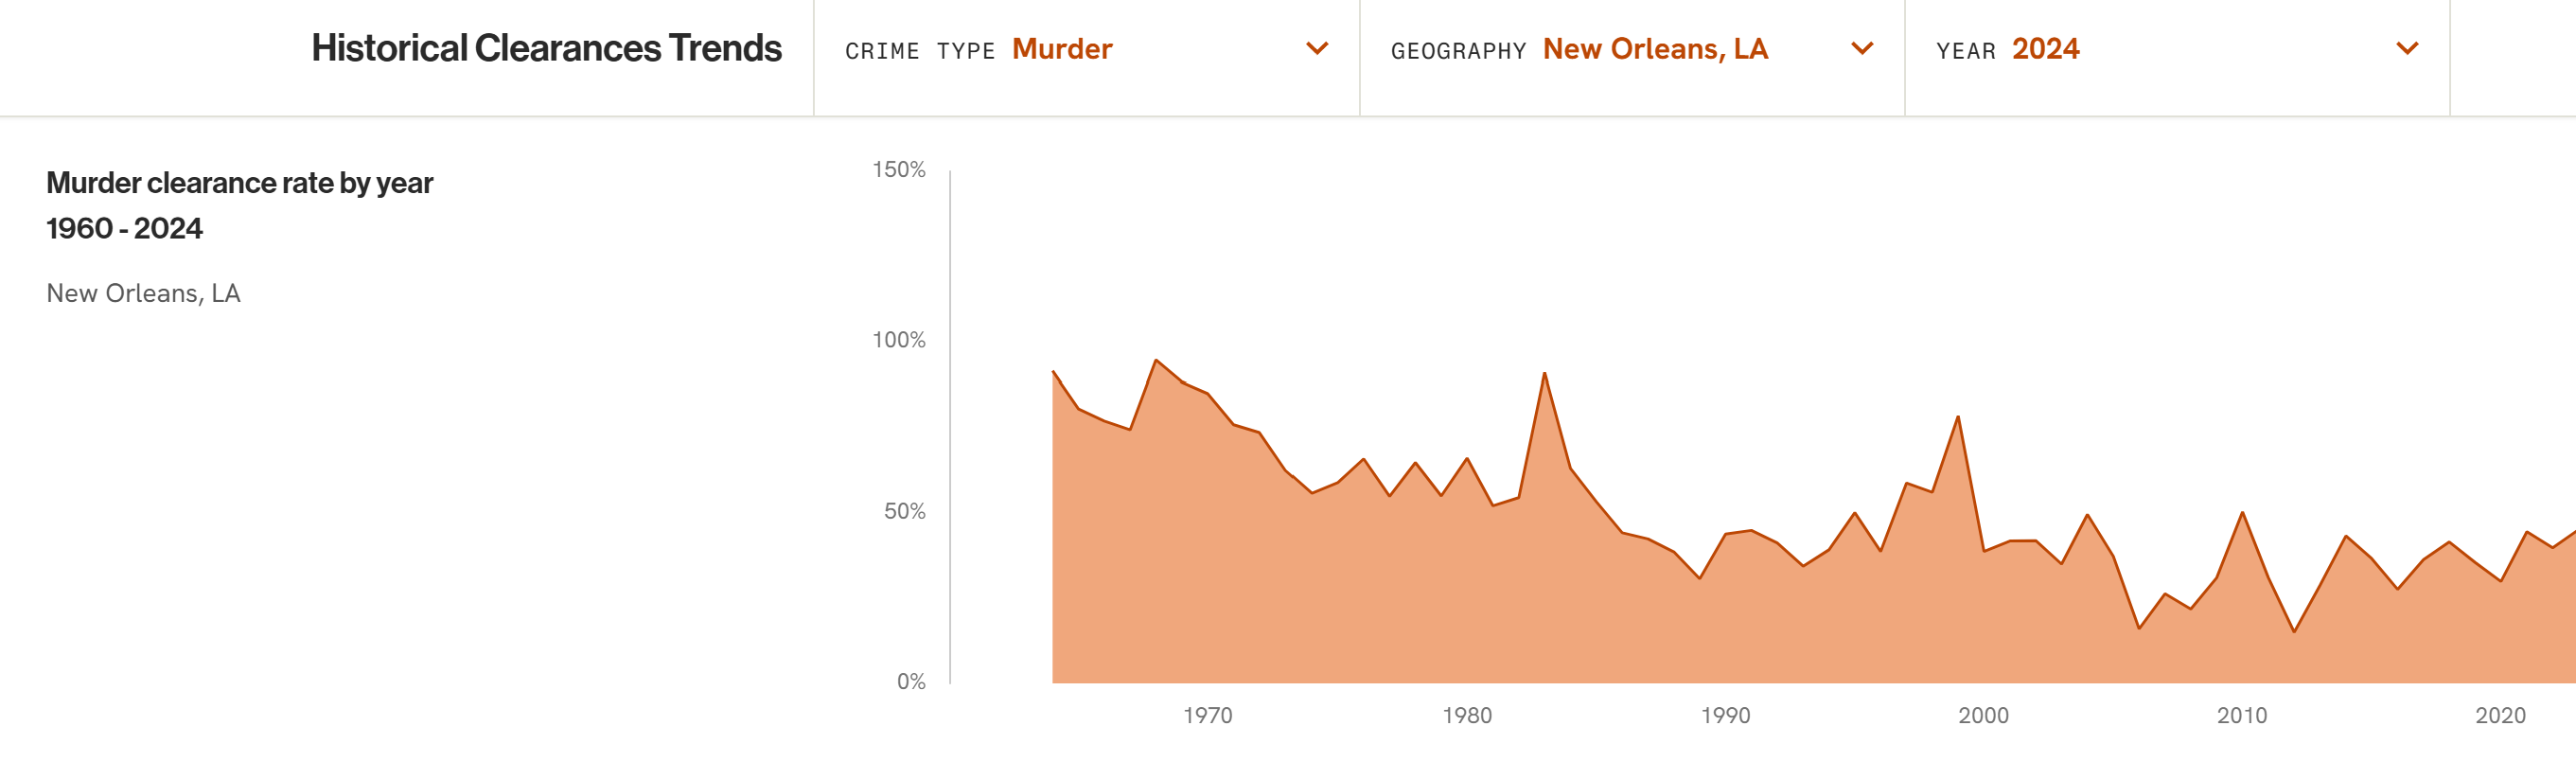
Or agency level.
The current and historical data aren’t inherently always apples-to-apples, so they’re displayed separately. Doing it in this manner allows us to show as much crime data as possible while also keeping things intellectually honest.
Beyond crime and clearance data, there is agency-level staffing data going back to 1930 for places that published that far back. We don’t do national staffing data because it’s generally unreliable, but agency data is there for the picking!
Doing this project, we learned a lot about historical crime data collection, and if something is missing then there’s probably a reason we made the choice not to include it. It’s not possible to show everything that the FBI has ever collected in a user-friendly format, but the Historical Data Library is designed to show as much as we could to give a reliable picture of how crime and policing have changed over the last 65 to 95 years.
The whole endeavor is incredibly exciting and it was designed and built by Hyperobjekt. They’ve done a ton of really cool websites in this general space and have had to put up with a full year of me explaining why their common sense ideas were no match for the inane complexity of crime data.
And the whole crazy endeavor was made possible by the amazing support of Arnold Ventures.
If you have thoughts or feedback we’d love to hear it, so send them to us here, we’ll do our best to address any glaring issues we may have missed. Like any new site there are undoubtedly small bugs here and there that need to be ironed out, but please enjoy the site ans be ready for the Crime Index to completely change the world…of crime data aggregation and reporting!
New on the Jeff-alytics Podcast
“We should treat gun violence like a public health problem” is a phrase that is often used but rarely defined.
My guest today is Dr. Megan Ranney, an emergency physician, injury prevention researcher, and the Dean of the Yale School of Public Health .
She sees firearm injury as part of a much broader health issue, one that affects not just the person who was shot, but families, communities, health care providers, and the systems that are supposed to respond afterward.
In this episode, we talk about what a public health approach to firearm injury actually means, why that framework is often misunderstood, and how public health researchers think about prevention differently from the way these conversations usually happen in politics or media.
You can also catch it on the Jeff-alytics YouTube page where I’ll be posting episodes and video clips, so be sure to like and subscribe there if you’re so obliged!
And while you’re here, be sure to check out these other recent great episodes:
Fund for a Safer Future CEO Rob Wilcox
Niskanen Center Director of Criminal Justice Greg Newburn
Center for American Progress CEO Neera Tanden
Senator Chris Murphy
Very exciting! Looking forward to playing around with this valuable tool