

It has been a year and a half since I published one of these and I figured I was overdue for a new Cautionary Crime Data Tale. Here are parts 1 through 5…
Now on to Part 6.
I came across a recent Mental Floss article that I didn’t love and then, right as I was finishing up this article, Men’s Journal published something very similar. The Mental Floss article was titled “The Most—And Least—Dangerous States, Mapped” with the subtitle “Violent crime has declined nationwide, but the latest FBI data shows that where you live still makes a big difference.” Men’s Journal titled their article “Map Shows the Most Dangerous States in the U.S. in 2026, and Illinois Isn’t No. 1.”
I’m not here to attack anybody or be mean-spirited, but I do want to point out the data-specific ways that these articles missed the mark. The errors are pretty common when dealing with crime data and ideally pointing them out here would lead to them not being repeated sometime down the line.
The Mental Floss piece starts off…
“The crime rate can be an important factor to consider when you're thinking about where you want to live or work. But just how safe is a particular state?”
Ok, I have a few issues with this. To begin with, my least important nit to pick is that I take exception to the idea of measuring the violent crime rate at a state level and calling it a meaningful factor to consider when you’re thinking about where you want to live or work. At a city or neighborhood level, absolutely, but I’m skeptical that there are many people who decide where to live based on state-level reported violent crime rates. At least they shouldn’t be.
That’s a minor complaint though.
Next, the piece’s author says “The good news is that crime is going down overall in the United States, with 359 violent crimes per 100,000 people. That’s a decline from 380 crimes a year earlier and 390 crimes in 2023, according to data from the Federal Bureau of Investigation.”
Alright, so, if I’m reading this confusing sentence right, they’re saying that the violent crime rate in 2025 was 359 per 100k, which is down from 380 in 2024 and 390 in 2023. I think.
The years are off though. This piece was published before the FBI’s 2025 data was released, and the FBI reported a violent crime rate of 359 per 100k in 2024. That was down from 380 in 2023 and 390 in 2022. The rate in 2025 was 327 per 100k and it’s approaching 310 per 100k most likely in 2026 (give or take).
The years are off which is also somewhat minor, but then we get this map that I really don't love.
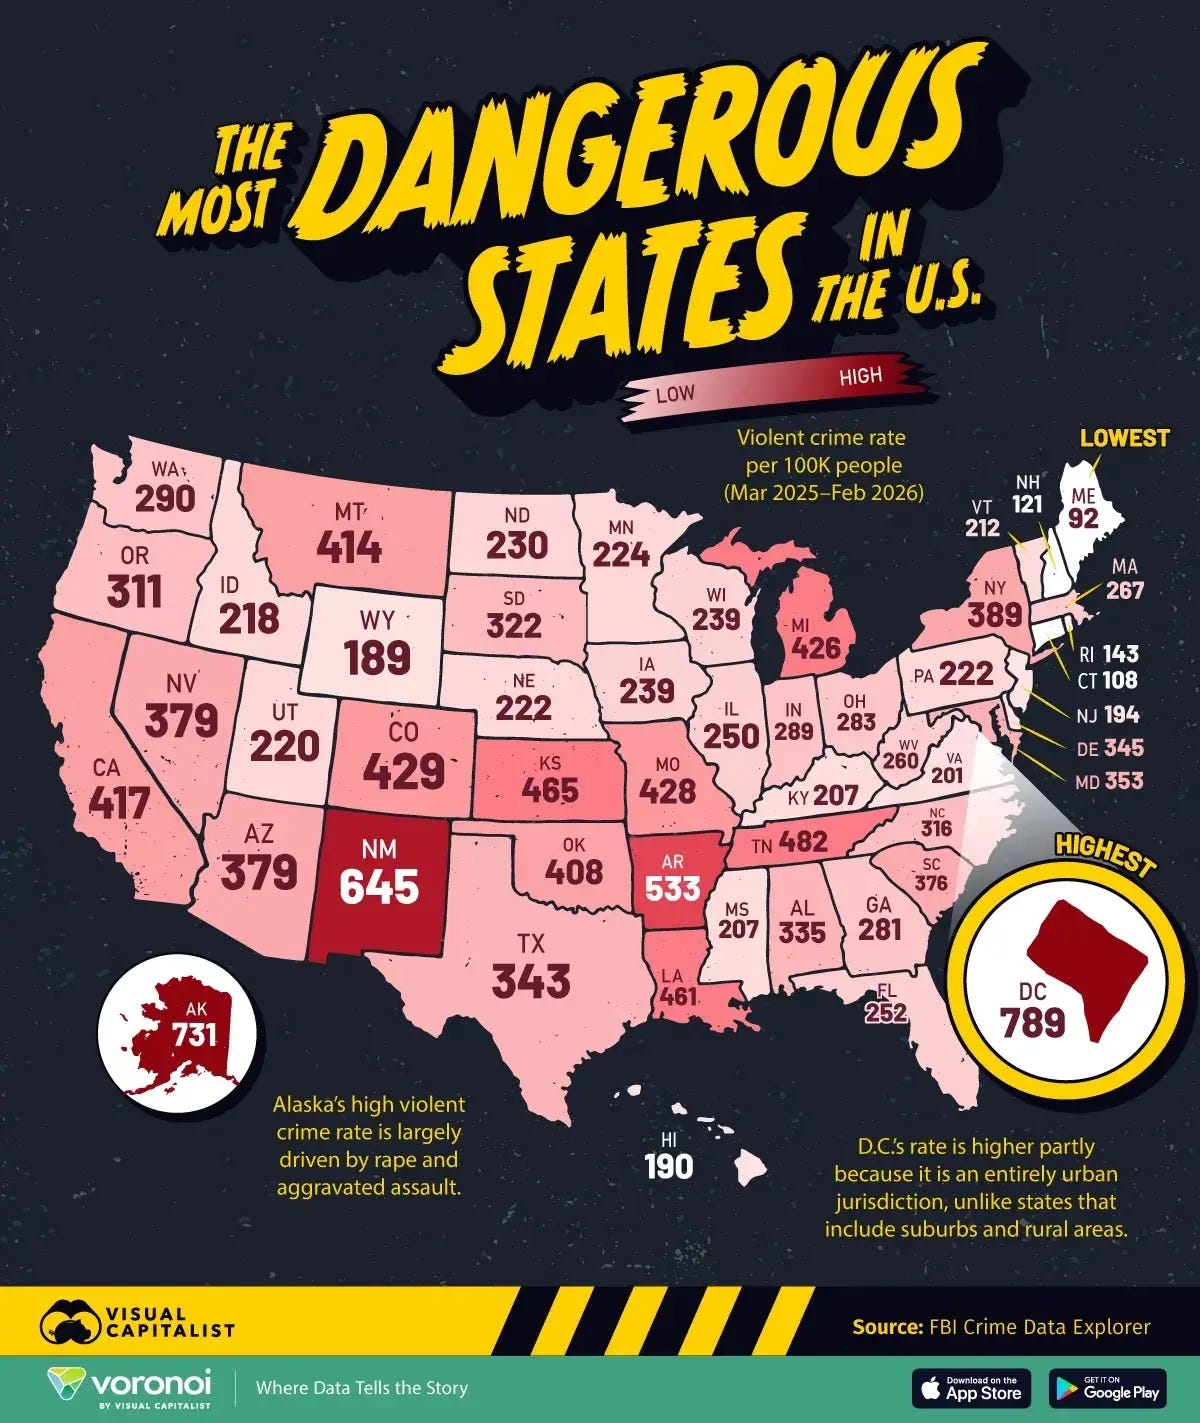
It’s a map from something called Visual Capitalist that takes CDE violent crime rates per state. The source is a somewhat tough to find download on the CDE that compares a 12-month total to the 12-months before that with a 3 month lag applied. So right now you can download May 2025 to April 2026 data (Visual Capitalist downloaded it when March 2025 to February 2026 was available) and compare crime totals to a year prior. It’s a bit confusing, but it’s at least a real dataset.
I have two major problems with this map. First, the data’s not complete. About 90 percent of the country’s population is populating this spreadsheet with monthly data sent to the FBI. That’s good!
But it varies significantly by state which is bad. Only 60 percent of Mississippi’s population is covered and Jackson — the city with about a fifth of the state’s violent crime count — hasn’t reported complete data to the FBI since 2019. Florida and Louisiana stand out as big under-reporters of crime data with New Orleans (my hometown) a glaring omission.
Comparing incomplete Mississippi and Louisiana and Florida crime counts to complete or nearly complete crime counts in Virginia and Nevada is never a good idea. Yet that’s what’s being done here.
I also am not a huge fan of equating dangerousness of a state with its violent crime rate. Yes, violent crime is bad, but there are so many other factors that make up a place’s dangerousness such as traffic safety, air pollution, overall availability of health services, and potholes (to name just a few) that contribute to whether a state is safe or dangerous.
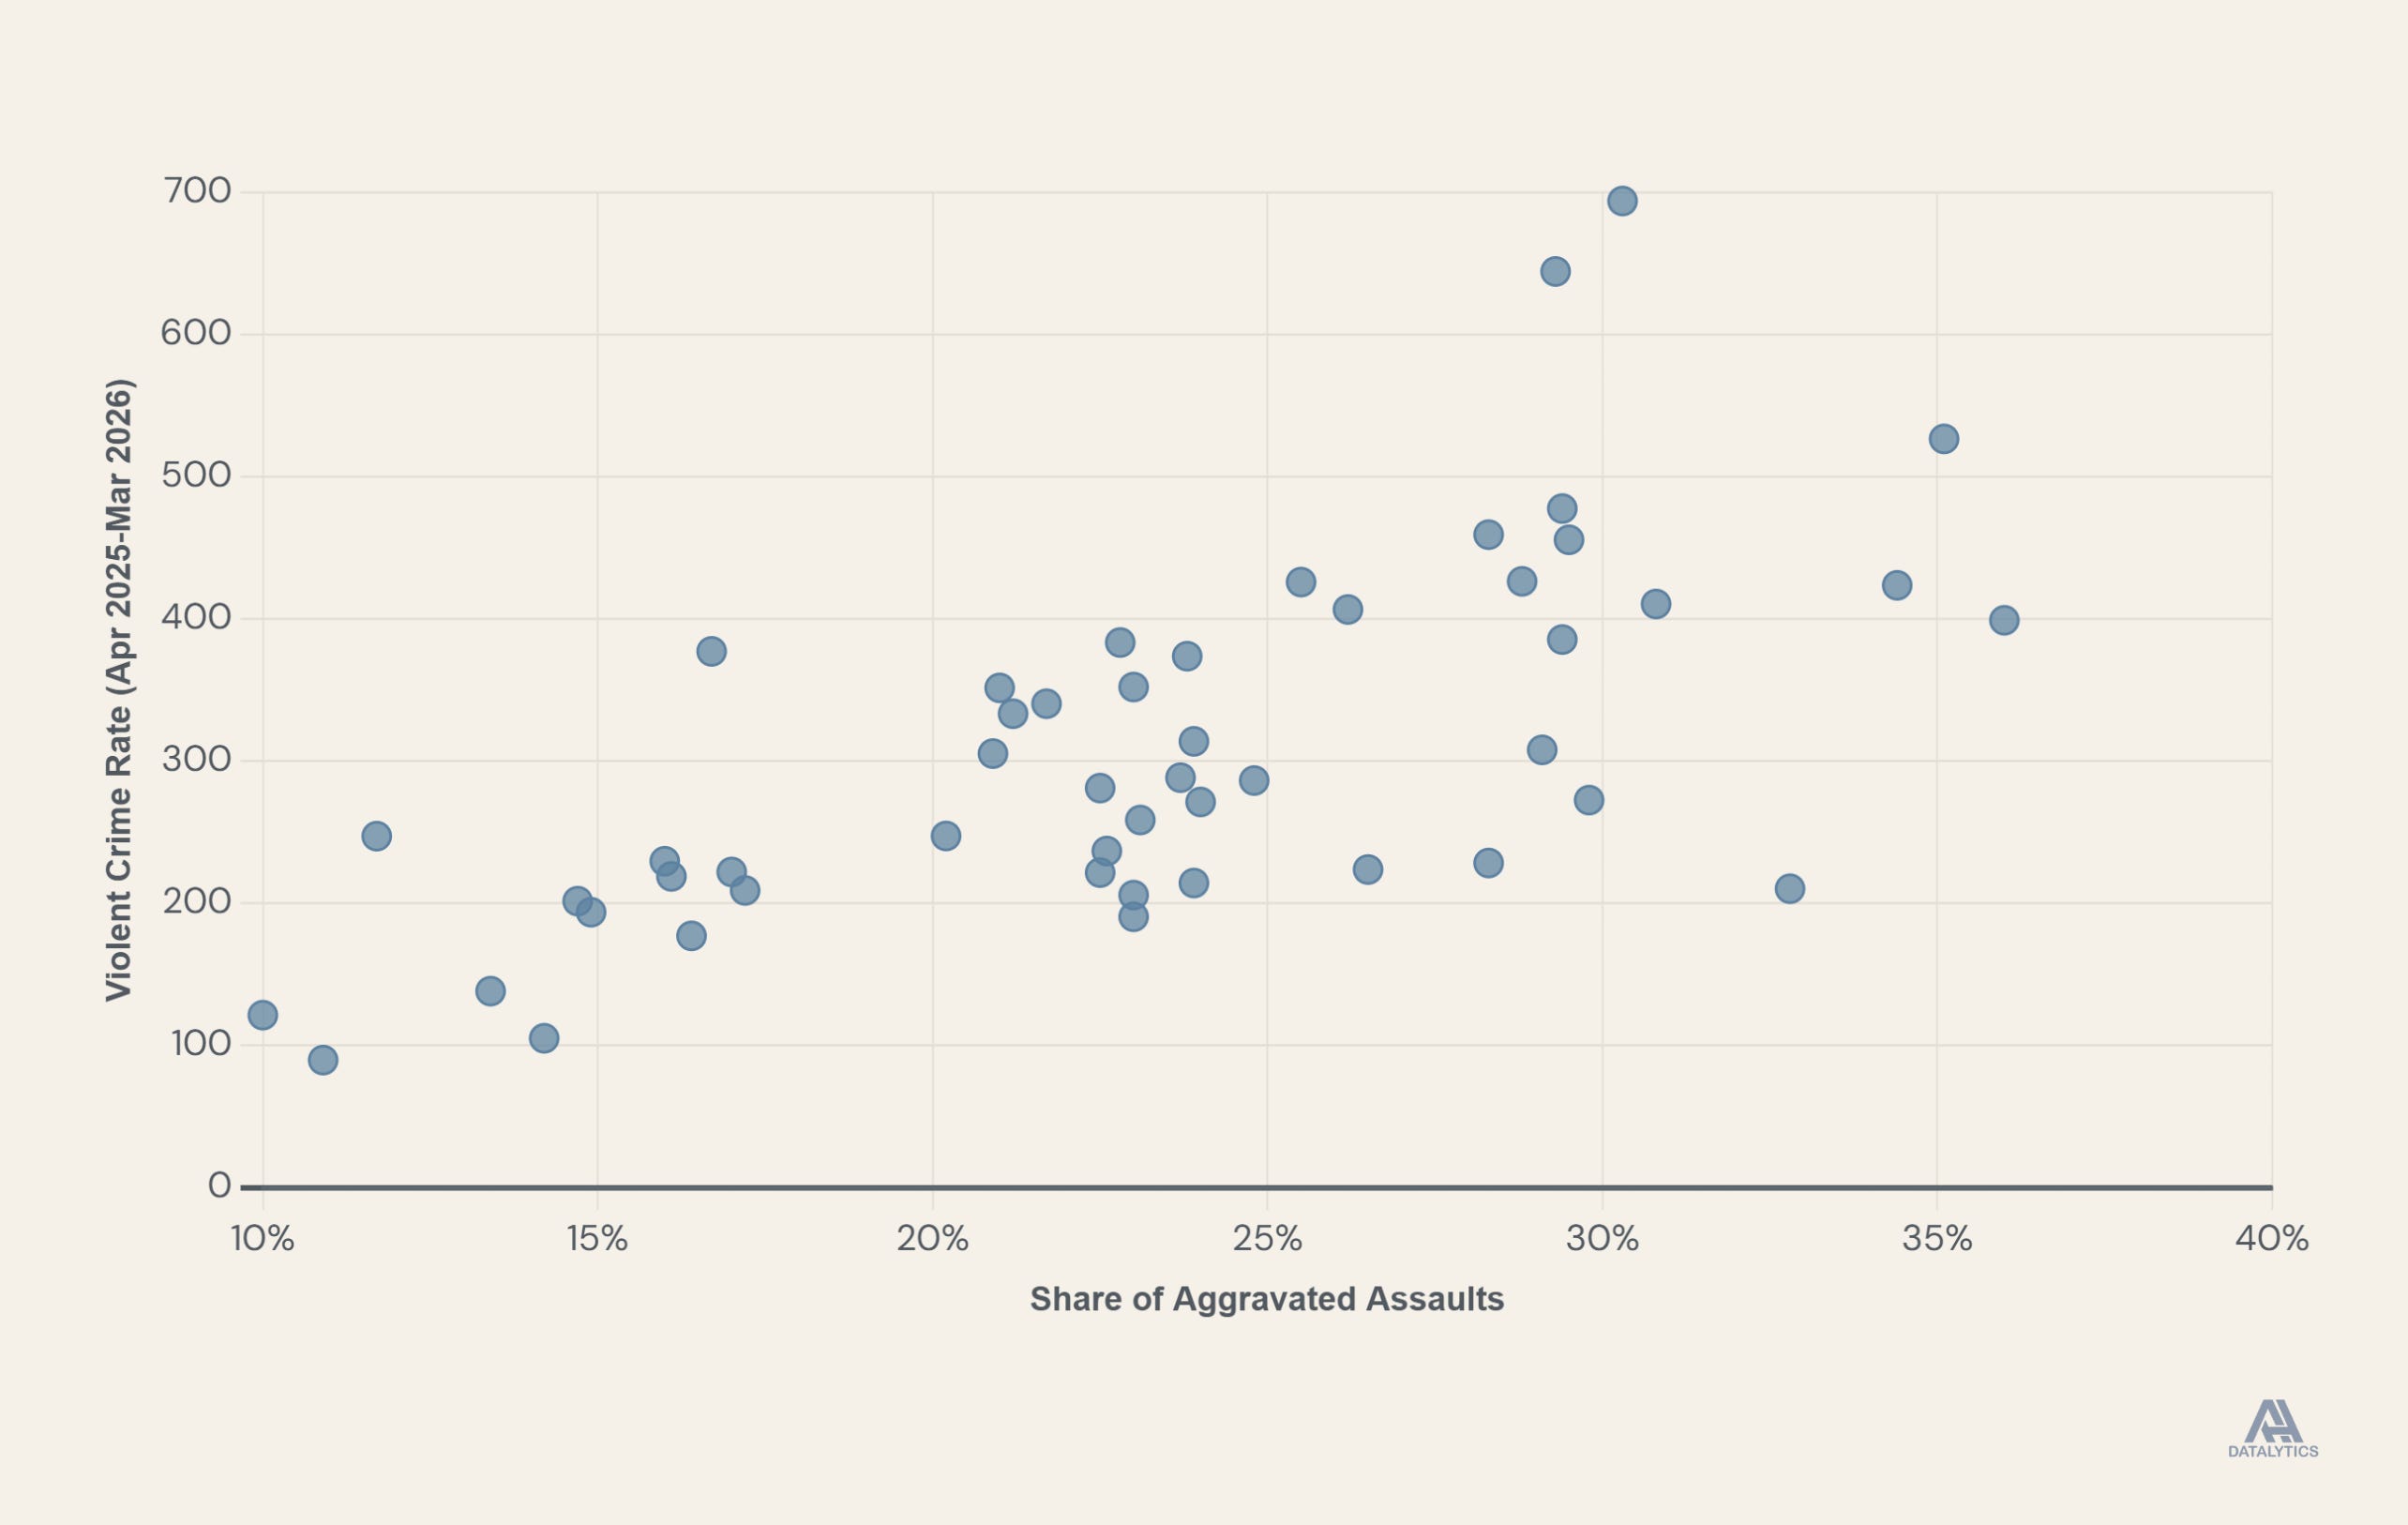
The violent crime rate is mostly a factor of a state’s aggravated assault rate (73 percent of reported violent crimes in the US in 2025 were aggravated assaults), and reporting practices determining whether assaults are aggravated or simple can vary wildly between states. Only around 10 percent of all assaults in 2025 were aggravated assaults in New Hampshire, Maine and Illinois compared to 30 percent in Alaska, Arkansas and Vermont. Is the nature of assault markedly different in Vermont compared to Maine or New Hampshire?
My guess is that the application of what is an aggravated versus a simple assault can vary a good bit between states, hence why the the FBI’s caution against ranking is wise. The FBI definitions of the two crimes does leave some ambiguity. Aggravated assault is defined as “an unlawful attack by one person upon another for the purpose of inflicting severe or aggravated bodily injury.” Aggravated assault usually involves a weapon while attempted aggravated assault (counted as aggravated assaults) include the display of or threat of a weapon or otherwise threatening to inflict serious personal injury. A simple assault on the other hand is an assault without a weapon or one “in which the victim did not sustain serious or aggravated injuries.”
A non-fatal shooting is quite obviously an aggravated assault, but what about a punch in a fight? It isn’t always so cut or dry whether a victim sustained “serious” injury.
Indeed, there’s a pretty decent enough correlation between a state’s violent crime rate and the share of assaults that are aggravated meaning that some states are probably reporting higher violent crime rates just because their officers label a higher share of assaults as aggravated.
My final nit to pick starts below the map with the actual ranking of states by dangerousness. The piece continues:
“The Capital Is the Capital of Crime
Washington, D.C., has the highest violent crime rate for crimes committed from March 2025 to February 2026, according to FBI data. The district saw 789 violent crimes committed per 100,000 residents. One reason for this high crime rate is the nature of the nation's capital. Washington, D.C. is an entirely urban jurisdiction compared to states that have urban, suburban, and rural areas.”
Yes, Washington DC is a city which has a higher violent crime rate than any state. Because it is the only city that is sort of treated like a state. DC had the 25th highest violent crime rate for any agency covering 250,000 or more people in the CDE’s monthly data, but we aren’t treating Wichita or Toledo like states. At least they acknowledge how silly including DC in a list of state crime rates is.
The piece goes on to say:
“Other states landed in the top 10 overall most dangerous states because of the rate of specific crimes in their cities. Louisiana, for example, made the top 10 most dangerous states because of New Orleans, which has the highest murder rate in the country with 46 homicides per 100,000 people.”
Remember when I mentioned New Orleans is not included in the FBI’s monthly reporting? Well, it gets included in the writeup about violent crime in Louisiana even though the city isn’t contributing to the state’s violent crime rate and hasn't reported data to the FBI since 2023. And New Orleans is assigned a murder rate of 46 per 100k which is not a murder rate the city has had anytime recently. The city’s murder rate in 2025 was around 33 per 100k, in 2024 it was 34, and it 2023 (the last time the city reported to the FBI) it was 52 per 100k.
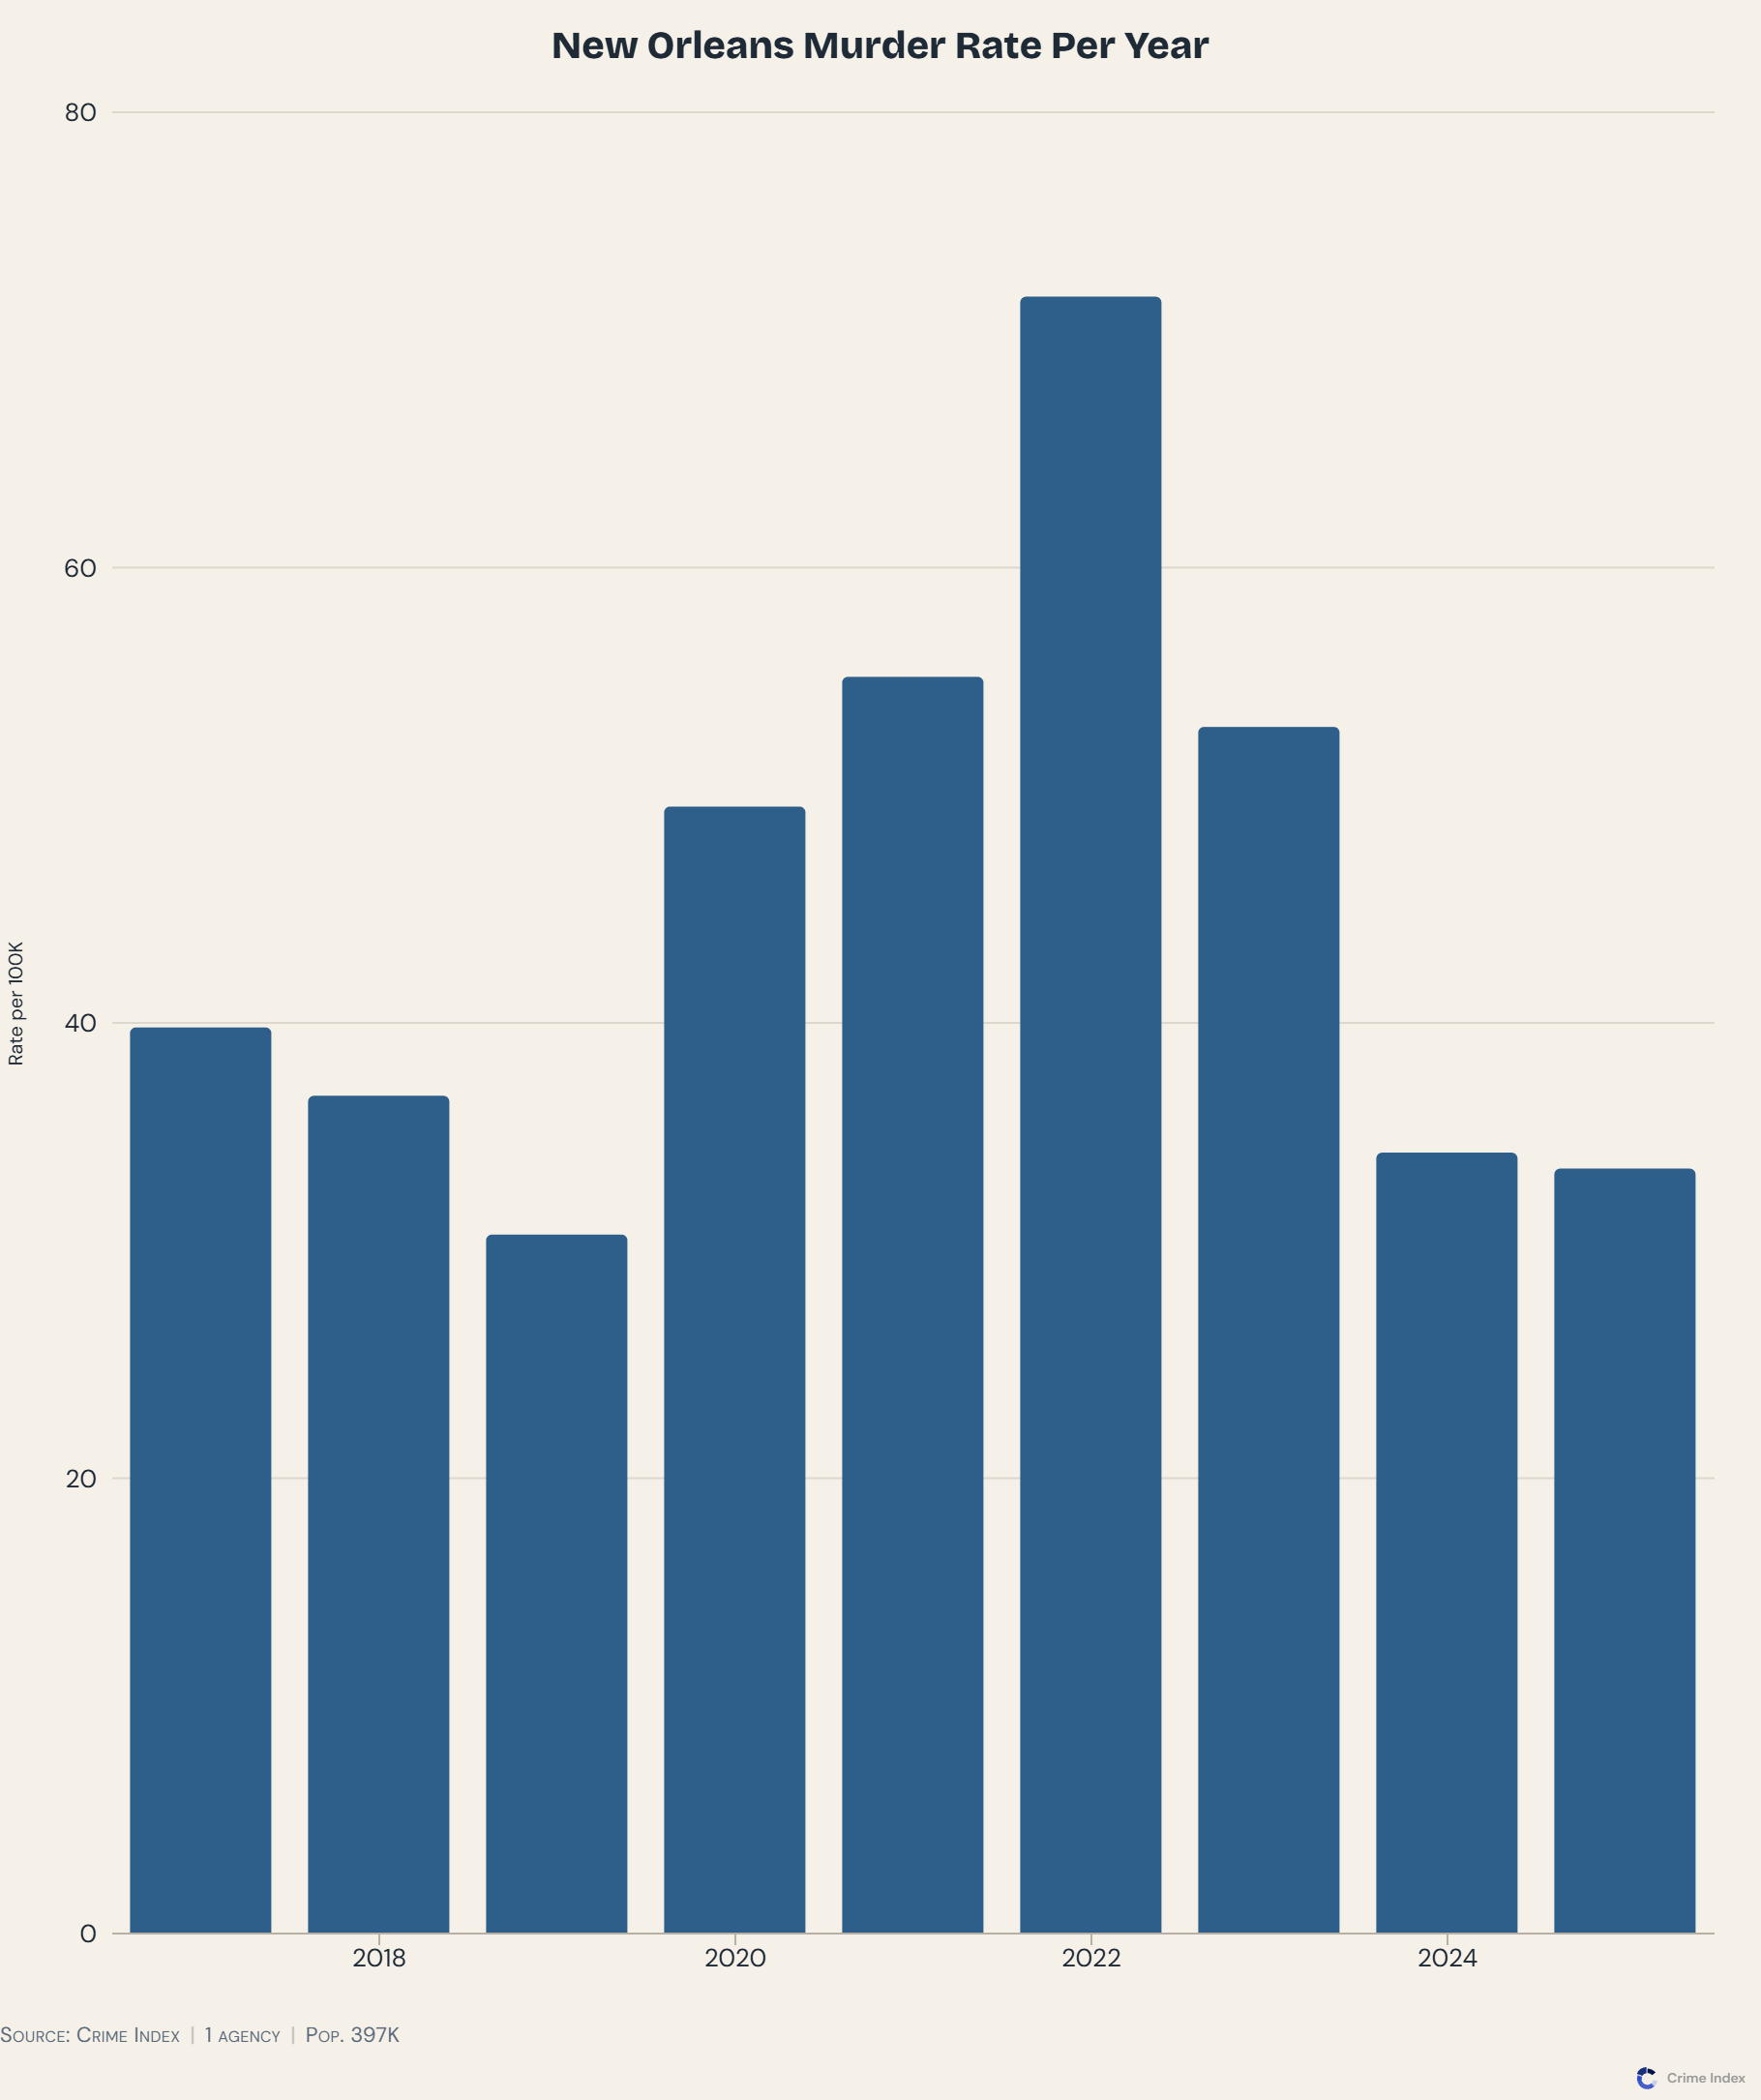
So Louisiana made the top ten without New Orleans yet New Orleans still gets called out. The Men's Journal piece has other simar state-related annoyances.
I had written this piece well before the Men’s Journal article came out, but the title — “Map Shows the Most Dangerous States in the U.S. in 2026, and Illinois Isn’t No. 1.” irked me. This sentence also irked me: “Illinois is the bigger shock. Home to the city Americans instinctively associate with crime, Illinois ranks 31st among the 50 states at 250, below Florida (252) and Massachusetts (267).”
I’ve already explained why Florida’s data is problematic, but this comment is annoying misguided for several reasons. Chicago has crime, for sure, but the city’s crime rate is not the highest in the country. Illinois has not been in the top 10 in terms of highest violent crime rate in the country since 2002 though the state’s lower recent ranking is impacted by troubles with reporting from Chicago.
Any sentence constructed as X is the highest thing and not Y which is not what I expected says something about your expectations, not Y’s ranking. Illinois isn't number one because your perception of Illinois is misguided.
So there you have my explanation about why I didn’t love these pieces. I hope you’ve gotten a few pretty good takeaways. There’s a caution against ranking — especially if the reporting is not all complete, a caution about reading too much into FBI data without being appropriately…cautious, and a caution against conflating reported violent crime with dangerousness.
If you want to write about crime data, great! But doing so means you have to be careful about the timeframes being discussed, possible data completion issues, and always be mindful that there could be alternative data-specific explanations to what looks like a crime trend. It is possible to analyze crime data, but there should always be some uncertainty and effort made to avoid comparing places that might not be apple-to- apple.
New on the Jeff-alytics Podcast
Minneapolis recorded more shooting victims than it had sworn police officers in 2021. At that time, a huge chunk of the department had walked out the door just as gun violence had surged and the city council was publicly vowing to reorganize what remained.
Someone still had to show up and run the thing. That someone was Brian O’Hara.
A career law enforcement officer who started as a beat cop in Newark in 2001, Brian rose to become that city’s public safety director before taking on what may have been the hardest job in American policing: rebuilding the Minneapolis Police Department from near-collapse while simultaneously trying to win back a traumatized community.
You can also catch it on the Jeff-alytics YouTube page where I’ll be posting episodes and video clips, so be sure to like and subscribe there if you’re so inclined!
And while you’re here, be sure to check out these other recent great episodes:
Michigan Economist Mike Mueller-Smith
Former ATF COO Thomas Chittum
Northwestern sociologist Andrew Papachristos
Vera President Insha Rahman
Thanks for sharing this Jeff. It is spot on. The FBI stopped producing rankings like these twenty years ago for precisely these reasons. Even city rankings make little sense given the degree to which municipal political boundaries vary across the country (some cities encompass large sections of their suburban communities while others just include their urban cores). The bottom line to me is that people don’t live in states, or even cities, they live in neighborhoods and therefore it is the conditions in neighborhoods that they should care about.
Good discussion of meaningless numbers.
As far as state level violent crime rates, a few years back on his own blog, Wake Forest Sociologist David Yamane quipped that people don't live in a state. They don't even live in a city. They live in a neighborhood, so that's where safety is important. I had posted a crime map of Chicago some years back on my own blog and noted that different parts of the city differed in homicide rate by roughly two orders of magnitude.
New Mexico perpetually competes for worst educational outcomes, most pedestrians killed in traffic, and a high violent crime rate. I think Santa Fe is the pothole capital of the state. But like Chicago, numbers are highly specific to locations. The International District in Albuquerque, for example, is colloquially referred to as the War Zone. Anyone driving through it says that is obvious.
So it goes.